Sample 24903: Create a block map using the SHAPE= option with PROC GMAP
This sample code uses the SHAPE= option on the BLOCK statement of PROC GMAP to specify the shape to be used for blocks in a block map.
These sample files and code examples are provided by SAS Institute
Inc. "as is" without warranty of any kind, either express or implied, including
but not limited to the implied warranties of merchantability and fitness for a
particular purpose. Recipients acknowledge and agree that SAS Institute shall
not be liable for any damages whatsoever arising out of their use of this material.
In addition, SAS Institute will provide no support for the materials contained herein.
This sample code uses the SHAPE= option on the BLOCK statement of PROC GMAP to specify the shape to be used for blocks in a block map.
The graphics output in the Results tab was produced using SAS® 9.2. Submitting
the sample code with releases of SAS prior to SAS 9.2 might produce different results.
 /* Set the graphics environment */
goptions reset=all cback=white border htitle=12pt htext=10pt;

 /* Create the population data set for Idaho */
data popdata;
  State=16;
  input County POP99;
  datalines;
1 280794
3 4546
5 78641
7 7033
9 8738
11 47036
13 19541
15 5839
17 36437
19 94927
21 9949
23 3147
25 853
27 116441
29 7614
31 22776
33 934
35 9429
37 3836
39 19614
41 10322
43 12351
45 15052
47 13429
49 16135
51 20881
53 17760
55 102833
57 36240
59 7816
61 3921
63 3979
65 25947
67 23199
69 39041
71 3603
73 9212
75 20619
77 9057
79 12901
81 5330
83 63698
85 9352
87 9475
;

 /* Create a format to define the population ranges */
proc format;
  value popfmt low-100000     = 'Up to 100,000'
               100001-200000  = '100,000 - 200,000'
               200001-high    = 'Over 200,000';
run;

 /* Project the map data set for Idaho */
proc gproject data=maps.counties out=idahocty;
  where state=16;
  id state county;
run;

title1 'Population by County for Idaho';

legend label=('Population for 1999');

 /* Create the map of population by county. */
proc gmap data=popdata map=idahocty all;

  /* Format the population variable */
  format pop99 popfmt.;
  id state county;

  /* Use the SHAPE= option to specify a hexagon */
  block pop99 / discrete coutline=black shape=hexagon
                cblkout=black blocksize=4 legend=legend1;
run;
quit;
These sample files and code examples are provided by SAS Institute
Inc. "as is" without warranty of any kind, either express or implied, including
but not limited to the implied warranties of merchantability and fitness for a
particular purpose. Recipients acknowledge and agree that SAS Institute shall
not be liable for any damages whatsoever arising out of their use of this material.
In addition, SAS Institute will provide no support for the materials contained herein.
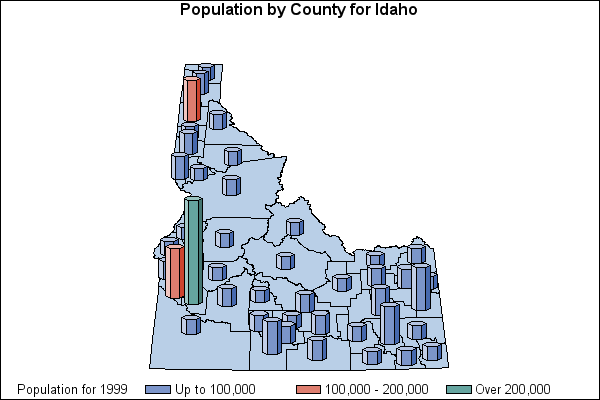
This sample code uses the SHAPE= option on the BLOCK statement of PROC GMAP to specify the shape to be used for blocks in a block map.
| Type: | Sample |
| Topic: | SAS Reference ==> Procedures ==> GMAP
Query and Reporting ==> Creating Reports ==> Graphical ==> Graph Types ==> Maps ==> Other Maps
|
| Date Modified: | 2005-08-31 03:03:07 |
| Date Created: | 2004-11-11 11:07:58 |
Operating System and Release Information
| SAS System | SAS/GRAPH | All | n/a | n/a |


