Sample 24900: Label states on a US map with PROC GMAP
 |  |  |  |  |
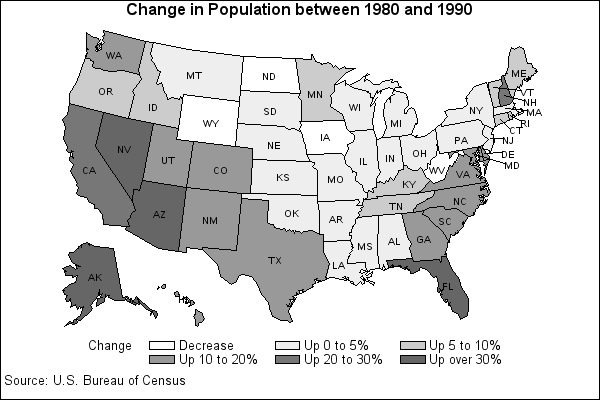
This sample program uses PROC GMAP with Annotate to label states on a United States map.
These sample files and code examples are provided by SAS Institute Inc. "as is" without warranty of any kind, either express or implied, including but not limited to the implied warranties of merchantability and fitness for a particular purpose. Recipients acknowledge and agree that SAS Institute shall not be liable for any damages whatsoever arising out of their use of this material. In addition, SAS Institute will provide no support for the materials contained herein.
This sample program uses PROC GMAP with Annotate to label states on a United States map.
The graphics output in the Results tab was produced using SAS® 9.2. Submitting the sample code with releases of SAS prior to SAS 9.2 might produce different results.
 /* Set the graphics environment */
goptions reset=all cback=white border htitle=12pt htext=10pt;


 /* Create the response data set, POP. The data for POP contains   */
 /* state abbreviations (ST) and the percent of population change  */
 /* for each state (CHANGE). The STFIPS function converts the      */
 /* two-letter postal codes to numeric FIPS codes (STATE) that can */
 /* be used as an identification variable with the map data set,   */
 /* MAPS.USCENTER.                                                 */
data pop(drop=st);
   input ST $ Change @@;
   State=stfips(st);
   datalines;
AL 3.8  AK 36.9 AZ 34.8 AR 2.8  CA 25.7
CO 14.0 CT 5.8  DE 12.1 FL 32.7 GA 18.6
HI 14.9 ID 6.7  IL 0.0  IN 1.0  IA -4.7
KS 4.8  KY 7.0  LA 0.3  ME 9.2  MD 13.4
MA 4.9  MI 0.4  MN 7.3  MS 2.1  MO 4.1
MT 1.6  NE 0.5  NV 50.1 NH 20.5 NJ 5.0
NM 16.3 NY 2.5  NC 12.7 ND -2.1 OH 0.5
OK 4.0  OR 7.9  PA 0.1  RI 5.9  SC 11.7
SD 0.8  TN 6.2  TX 19.4 UT 17.9 VT 10.0
VA 15.7 WA 17.8 WV -8.0 WI 4.0  WY -3.4
;
run;

 /* Create the Annotate data set, MAPLABEL, from MAPS.USCENTER.   */
 /* MAPLABEL labels each state with a two-letter abbreviation.    */
 /* MAPS.USCENTER provides the x and y coordinates for the labels */
 /* FLAG, which is initially turned off, signals when external    */
 /* labeling is in effect. The labels are drawn after the map     */
 /* because the value of WHEN is a (after).                       */
data maplabel;
   length function $ 8;
   retain flag 0 xsys ysys '2' hsys '3' when 'a' style "'Albany AMT'";
   set maps.uscenter(drop=long lat);

   where fipstate(state) ne 'DC' and  fipstate(state) ne 'PR';

   function='label'; text=fipstate(state); size=2.5; position='5';

     /* The FIPSTATE function creates the label   */
     /* text by converting the FIPS codes from    */
     /* MAPS.USCENTER to two-letter postal codes. */

   if ocean='Y' then
      do;
         position='6'; output;
         function='move';
         flag=1;
      end;

  /* If the labeling coordinates are outside the state (OCEAN='Y'), Annotate    */
  /* adds the label and prepares to draw the leader line. Note: OCEAN is a      */
  /* character variable and is therefore case sensitive. OCEAN='Y' must specify */
  /* an uppercase Y.                                                            */

  /* When external labeling is in effect, Annotate */
  /* draws the leader line and resets the flag.    */
   else if flag=1 then
      do;
         function='draw'; size=.5;
         flag=0;
      end;
   output;
run;

 /* Create a format for the value of CHANGE. The PCHANGE. */
proc format;
   value pchange   low - -0.01 = 'Decrease'    /* Format asssociates descriptive labels with ranges of */
                   0.0 - 5     = 'Up 0 to 5%'  /* population values.                                   */
                  5.01 - 10    = 'Up 5 to 10%'
                 10.01 - 20    = 'Up 10 to 20%'
                 20.01 - 30    = 'Up 20 to 30%'
                 30.01 - high  = 'Up over 30%';
run;


 /* Define patterns for the map.  Pattern colors are gray-scale  */
 /* values ranging from GRAY44 (dark gray) to GRAYFF (white).    */
 /* Because patterns are assigned in order to response values,   */
 /* beginning with the lowest value, the patterns are ordered    */
 /* from lightest to darkest, so that white represents the least */
 /* change and dark gray the most.                               */
pattern1 value=solid color=grayff;    /* white */
pattern2 value=solid color=grayee;
pattern3 value=solid color=graycc;
pattern4 value=solid color=gray99;
pattern5 value=solid color=gray77;
pattern6 value=solid color=gray66;

 /* Add titles and footnotes. */
title1 'Change in Population between 1980 and 1990';
footnote1 justify=left ' Source: U.S. Bureau of Census';
footnote2  ' ';

 /* Produce the map. The CHORO statement includes the annotation defined */
 /* in the MAPLABEL data set.  DISCRETE is added so that each formatted  */
 /* value of CHANGE is treated as a separate response level.             */
proc gmap data=pop map=maps.us;
   format change pchange.;
   id state;
   choro change /  discrete coutline=black annotate=maplabel;
run;
quit;
These sample files and code examples are provided by SAS Institute Inc. "as is" without warranty of any kind, either express or implied, including but not limited to the implied warranties of merchantability and fitness for a particular purpose. Recipients acknowledge and agree that SAS Institute shall not be liable for any damages whatsoever arising out of their use of this material. In addition, SAS Institute will provide no support for the materials contained herein.
This sample program uses PROC GMAP with Annotate to label states on a United States map.
| Type: | Sample |
| Topic: | SAS Reference ==> Procedures ==> GMAP Query and Reporting ==> Creating Reports ==> Graphical ==> Graph Elements ==> Annotation |
| Date Modified: | 2005-08-31 03:03:06 |
| Date Created: | 2004-11-11 11:07:57 |
Operating System and Release Information
| Product Family | Product | Host | SAS Release | |
| Starting | Ending | |||
| SAS System | SAS/GRAPH | All | n/a | n/a |
