Sample 24899: Draw latitude and longitude lines on a map using PROC GMAP and Annotate
 |  |  |  |  |
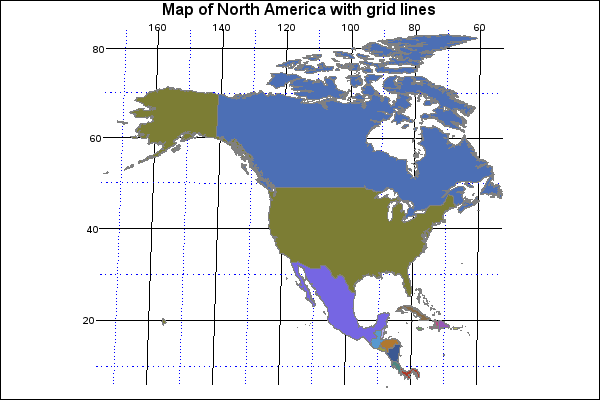
The sample code on the Full Code tab uses the GMAP procedure together with the Annotate facility to draw longitude and latitude grid lines on a map of North America.
These sample files and code examples are provided by SAS Institute Inc. "as is" without warranty of any kind, either express or implied, including but not limited to the implied warranties of merchantability and fitness for a particular purpose. Recipients acknowledge and agree that SAS Institute shall not be liable for any damages whatsoever arising out of their use of this material. In addition, SAS Institute will provide no support for the materials contained herein.
This sample program uses PROC GMAP together with the Annotate facility to draw longitude and latitude grid lines on a map of North America.
The graphics output on the Results tab was produced using SAS® 9.2. Submitting the sample code with releases of SAS prior to SAS 9.2 might produce different results.
 /*********************************************************/
 /* The following program uses the Annotate facility to   */
 /* draw longitude and latitude grid lines on a map of    */
 /* North America.  You can change the intervals at which */
 /* the dashed lines and solid lines are drawn by         */
 /* changing the values in the DINTERVL and SINTERVL      */
 /* macro variables, respectively.                        */
 /* This program also uses the XSIZE and YSIZE options on */
 /* the CHORO statement in PROC GMAP to specify the size  */
 /* of the map output.  You might need to change these    */
 /* values depending on your output device.               */
 /*********************************************************/

 /* Set the graphics environment */
goptions reset=all cback=white border htitle=12pt htext=10pt;

 /* Specify the interval (in degrees) at which the dashed */
 /* grid lines should be drawn.                           */
%let dintervl=10;

 /* Specify the interval (in degrees) at which the solid  */
 /* grid lines should be drawn.  Make sure that the value */
 /* is an even multiple of &DINTERVL                      */

%let sintervl=20;

 /* Since we want to annotate onto a map, we need to use  */
 /* the unprojected values from the map data set.  The    */
 /* NAMERICA map data set contains the projected          */
 /* longitude, X, the projected latitude, Y, as well as   */
 /* the unprojected longitude, LONG, and the unprojected  */
 /* latitude, LAT. In order to use the unprojected values */
 /* for the map, we need to drop the existing X and Y     */
 /* variables and rename the LONG and LAT variables to X  */
 /* and Y.                                                */

data namerica(rename=(long=x lat=y));
   set maps.namerica(drop=x y);
   if id=926 and segment > 20 then delete;
run;

run;

 /* Determine the minimum and maximum latitude and */
 /* longitude values in the map data set           */

proc means data=namerica noprint min max;
   var y x;
   output out=minmax min=miny minx max=maxy maxx;
run;

 /* Create macro variables for the minimum and maximum */
 /* latitude and longitude values                      */

data _null_;
  set minmax;

  /* Convert radians to degrees */
  miny=miny/(atan(1)/45);
  maxy=maxy/(atan(1)/45);
  minx=minx/(atan(1)/45);
  maxx=maxx/(atan(1)/45);

  /* Assign the min and max values to macro variables */
  call symput('miny',left(put(miny,4.)));
  call symput('maxy',left(put(maxy,4.)));
  call symput('minx',left(put(minx,4.)));
  call symput('maxx',left(put(maxx,4.)));
run;

 /* Create an annotate data set to draw and label the lines */

data anno;

  /* Specify the length for annotate variables */
  length color function text $ 8 style $ 20;

  /* The coordinate system is set to data values.   */
  /* The ANNO variable identifies observations from */
  /* the annotate data set.                         */
  retain xsys ysys '2' anno 1;

  /* Draw the longitude lines */
  do i = &minx to &maxx by 1;

    /* Convert degrees to radians */
    x = (atan(1)/45) * i;
    y = (atan(1)/45) * &miny;
    function='move';

    /* Check to see if a solid line should be drawn */
    if mod(i,&sintervl)=0 then do;

      /* Output the location to move to */
      output;

      /* Increment the Y value */
      y = (atan(1)/45) * (&maxy + 1);

      /* Specify a solid line style */
      line=1;

      /* Solid line should be black */
      color='black';

      /* Label the line */
      function='label';

      /* TEXT is the value to output */
      text=left(put(i,5.));

      /* Position the label one half cell centered */
      /* above the x,y location                    */
      position='B';

      /* Specify the font and size for the label */
      style="'Albany AMT'"; size=1;
      output;

      /* Draw the line with a size of 1.75*/
      function='draw'; size=1.75;
      output;
    end;

    /* Line should be dashed */
    else if mod(i,&dintervl)=0 then do;

      /* Output the location to move to */
      output;

      /* Increment the Y value */
      y = (atan(1)/45) * (&maxy + 1);

      /* Specify a dashed line style */
      line=33;

      /* Dashed line should be blue with a size of 1 */
      color='blue'; size=1;

      /* Draw the line */
      function='draw';
      output;
    end;
  end;

  /* Draw the latitude lines */
  do i = &miny to &maxy by 1;

    /* Convert degrees to radians */
    x = (atan(1)/45) * &minx;
    y = (atan(1)/45) * i;
    function = 'move';

    /* Check to see if a solid line should be drawn */
    if mod(i,&sintervl)=0 then do;

      /* Output the location to move to */
      output;

      /* Increment the X value */
      x = (atan(1)/45) * (&maxx + 1);

      /* Specify a solid line style */
      line=1;

      /* Solid line should be black */
      color='black';

      /* Label the line */
      function='label';

      /* TEXT is the value to output */
      text=trim(left(put(i,5.)));

      /* Position the label one half cell right aligned */
      position='<';

      /* Specify the font and size for the label */
      style="'Albany AMT'"; size=1;
      output;

      /* Add more points to curve the latitude */
      do j = &minx to (&maxx+1) by 1;

        /* Draw the line with a size of 1.75 */
        function='draw'; size=1.75;

        /* Increment the X coordinate */
        x = (atan(1)/45) * j;
        output;
      end;
    end;

    /* Line should be dashed */
    else if mod(i,&dintervl)=0 then do;

      /* Output the location to move to */
      output;

      /* Increment the X value */
      x = (atan(1)/45) * (&maxx + 1);

      /* Specify a dashed line style */
      line=33;

      /* Dashed line should be blue with a size of 1 */
      color='blue'; size=1;

      /* Add more points to curve the latitude */
      do j = &minx to (&maxx+1) by 1;

        /* Draw the line */
        function='draw';

        /* Increment the X value */
        x = (atan(1)/45) * j;
        output;
      end;
    end;
  end;
run;

 /* Since the annotation will extend beyond the map coordinates, */
 /* create dummy points for the four outer corners of the map.   */
 /* We need to include the identification variable, ID for the   */
 /* NAMERICA map data set, in the CORNERS data set.  Select      */
 /* values that will not correspond to values in the map data    */
 /* set.                                                         */

data corners;
   /* Convert degrees to radians and adjust the coordinates */
   x=(atan(1)/45) * (&minx-1);
   y=(atan(1)/45) * (&miny-1);
   id=-1; output;
   x=(atan(1)/45) * (&minx-1);
   y=(atan(1)/45) * (&maxy+1);
   id=-2; output;
   x=(atan(1)/45) * (&maxx+1);
   y=(atan(1)/45) * (&maxy+1);
   id=-3; output;
   x=(atan(1)/45) * (&maxx+1);
   y=(atan(1)/45) * (&miny-1);
   id=-4; output;
run;

 /* Combine all of the data sets together for projection */

data all;
   set corners namerica anno ;
run;

 /* Create a new data set, ALLPROJ, that contains the projected values  */
 /* specify the gnomonic projection and center the projection using the */
 /* polelong and polelat options.  The DUPOK option tells GPROJECT not  */
 /* to delete observations with duplicate X and Y values.               */
 /* If you want the map to reflect the curvature of the map, remove     */
 /* the PROJECT=, POLELONG=, POLELAT=, and DEGREE options.              */

proc gproject data=all out=allproj project=gnomon polelong=0 polelat=45 degree dupok;
   id id;
run;

 /* Separate the projected data back into an annotate data set and a */
 /* map data set.                                                    */

data namerica anno;
   set allproj;

   /* The ANNO variable value of 1 identifies observations from the */
   /* annotate data set.                                            */
   if anno=1 then output anno;
   else output namerica;
run;

pattern v=ms;

title1 'Map of North America with grid lines';

 /* Generate a map of North America with longitude and latitude grid lines */

proc gmap map=namerica data=namerica all;
   id id;

 /* Outline map areas in gray, suppress the legend, treat the ID variable */
 /* as a discrete variable, and specify the ANNO annotate data set.       */
   choro id / coutline=gray nolegend discrete
              anno=anno;
run;
quit;
These sample files and code examples are provided by SAS Institute Inc. "as is" without warranty of any kind, either express or implied, including but not limited to the implied warranties of merchantability and fitness for a particular purpose. Recipients acknowledge and agree that SAS Institute shall not be liable for any damages whatsoever arising out of their use of this material. In addition, SAS Institute will provide no support for the materials contained herein.
This sample program uses PROC GMAP together with the Annotate facility to draw longitude and latitude grid lines on a map of North America.
| Type: | Sample |
| Topic: | SAS Reference ==> Procedures ==> GMAP Query and Reporting ==> Creating Reports ==> Graphical ==> Graph Elements ==> Annotation |
| Date Modified: | 2007-11-13 14:52:18 |
| Date Created: | 2004-11-11 11:07:57 |
Operating System and Release Information
| Product Family | Product | Host | SAS Release | |
| Starting | Ending | |||
| SAS System | SAS/GRAPH | All | n/a | n/a |