Sample 24898: Create a map of selected counties within a state with PROC GMAP
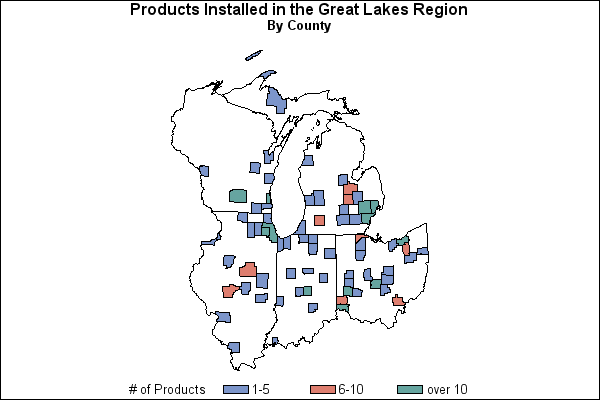
The sample code on the Full Code tab uses PROC GMAP to create a map that contains the map boundaries for only the counties in the response data set.
These sample files and code examples are provided by SAS Institute
Inc. "as is" without warranty of any kind, either express or implied, including
but not limited to the implied warranties of merchantability and fitness for a
particular purpose. Recipients acknowledge and agree that SAS Institute shall
not be liable for any damages whatsoever arising out of their use of this material.
In addition, SAS Institute will provide no support for the materials contained herein.
This sample program uses PROC GMAP to create a map that contains the map boundaries for only the counties in the response data set. The STATE and COUNTY variables in the response data set contain the Federal Information Processing Standards (FIPS) codes for the state and counties being mapped.
The graphics output on the Results tab was produced using SAS® 9.2. Submitting the sample code with releases of SAS prior to SAS 9.2 might produce different results.
 /* Set the graphics environment */
goptions reset=all cback=white border htitle=12pt htext=10pt;

 /* Create a sample data set */
data products;
   input State County Count;
   datalines;
 17  19   3
 17  29   1
 17  31 124
 17  37   3
 17  43  22
 17  77   3
 17  89   2
 17  97   5
 17 113   6
 17 115   4
 17 119   1
 17 143   3
 17 161   4
 17 167   8
 17 201   4
 18   3   4
 18   5   3
 18  35   1
 18  39   4
 18  63   3
 18  67   3
 18  85   2
 18  89   5
 18  97  32
 18 127   1
 18 141   4
 18 157   2
 18 163   2
 18 167   1
 26  21   1
 26  49   2
 26  65   1
 26  75   5
 26  77   8
 26  81   4
 26  83   1
 26  99  11
 26 101   1
 26 103   1
 26 111   4
 26 125  12
 26 139   4
 26 145   6
 26 155   8
 26 161   5
 26 163  26
 39   9   6
 39  17   6
 39  35  34
 39  45   3
 39  49  28
 39  57   2
 39  61  21
 39  63   3
 39  83   1
 39  89   2
 39  93   1
 39  95   9
 39  99   4
 39 109   2
 39 113  14
 39 149   2
 39 151   3
 39 153   9
 39 159   1
 39 173   1
 55   9   2
 55  25  12
 55  63   1
 55  79  25
 55 101   4
 55 117   2
 55 127   2
 55 139   2
;
run;

 /* Create a data set that contains the map boundaries */
 /* for only the counties in the response data set     */
 /* also create a data set for only the states which   */
 /* are contained in the response data                 */
data counties(drop=count test) selstate(keep=state);
   retain test 0 ;
   merge products(in=inprod) maps.counties(in=inmap);
   by state county ;
   if inprod and inmap;

   /* Determine which states are included in the response data */
   if state ^= test then do;
      output selstate;
      test=state;
   end;
   output counties;
 run;

 /* Get the unprojected coordinates for the states */
data states;
   merge maps.states selstate(in=inprod);
   by state;
   if inprod;
run;

 /* Concatenate states with counties map data set */
 /* for projection                                */
data newmap;
   set states counties;
run;

 /* Project the map coordinates and create a new map data set */
proc gproject data=newmap out=newmap;
   id state county;
run;
quit;

 /* Specify distribution format */
proc format;
   value dist 1-5='1-5' 6-10='6-10' 11-high='over 10';
run;

title 'Products Installed in the Great Lakes Region';
title2 h=10pt 'By County';

 /* Generate the map */
proc gmap data=products map=newmap all;
   id state county;
   choro count / discrete;
   format count dist.;
   label count='# of Products';
run;
quit;
These sample files and code examples are provided by SAS Institute
Inc. "as is" without warranty of any kind, either express or implied, including
but not limited to the implied warranties of merchantability and fitness for a
particular purpose. Recipients acknowledge and agree that SAS Institute shall
not be liable for any damages whatsoever arising out of their use of this material.
In addition, SAS Institute will provide no support for the materials contained herein.

This sample program uses PROC GMAP to create a map that contains the map boundaries for only the counties in the response data set.
| Type: | Sample |
| Topic: | SAS Reference ==> Procedures ==> GMAP
|
| Date Modified: | 2005-08-24 16:06:31 |
| Date Created: | 2004-11-11 11:07:57 |
Operating System and Release Information
| SAS System | SAS/GRAPH | All | n/a | n/a |


