Sample 24890: Change the outline width on a pie chart with PROC GCHART
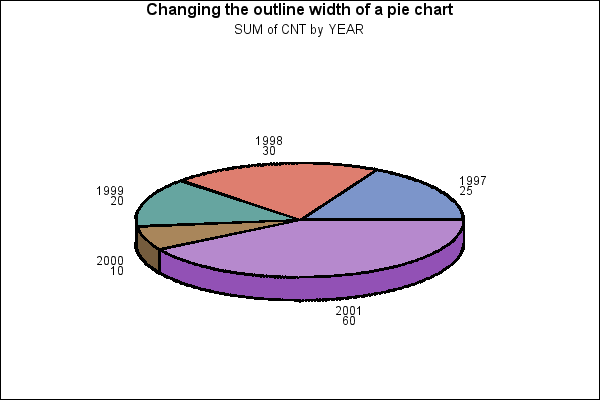
This sample uses PROC GCHART with the WOUTLINE option on the PIE3D statement to control the width of the outlines of the pie slices.
These sample files and code examples are provided by SAS Institute
Inc. "as is" without warranty of any kind, either express or implied, including
but not limited to the implied warranties of merchantability and fitness for a
particular purpose. Recipients acknowledge and agree that SAS Institute shall
not be liable for any damages whatsoever arising out of their use of this material.
In addition, SAS Institute will provide no support for the materials contained herein.
This sample uses PROC GCHART with the WOUTLINE option on the PIE3D statement to control the width of the outlines of the pie slices.
The graphics output in the Results tab was produced using SAS® 9.2. Submitting the sample code with releases of SAS prior to SAS 9.2 might produce different results.
 /* Set the graphics environment */
goptions reset=all cback=white border htitle=12pt;

 /* Define a data set for charting */
data a;
   input YEAR 4. CNT;
   datalines;
1997 25
1998 30
1999 20
2000 10
2001 60
;
run;

title1 'Changing the outline width of a pie chart';

proc gchart data=a;
  pie3d YEAR / sumvar=CNT woutline=2
               coutline=black discrete;
run;
quit;
These sample files and code examples are provided by SAS Institute
Inc. "as is" without warranty of any kind, either express or implied, including
but not limited to the implied warranties of merchantability and fitness for a
particular purpose. Recipients acknowledge and agree that SAS Institute shall
not be liable for any damages whatsoever arising out of their use of this material.
In addition, SAS Institute will provide no support for the materials contained herein.
This sample uses PROC GCHART with the WOUTLINE option on the PIE3D statement to control the width of the outlines of the pie slices.
| Type: | Sample |
| Topic: | SAS Reference ==> Procedures ==> GCHART
Query and Reporting ==> Creating Reports ==> Graphical ==> Graph Types ==> Charts ==> Pie
|
| Date Modified: | 2005-08-24 16:06:29 |
| Date Created: | 2004-11-11 11:07:55 |
Operating System and Release Information
| SAS System | SAS/GRAPH | All | n/a | n/a |


