Sample 24886: Annotate values above each midpoint bar with PROC GCHART
 |  |  |  |  |
If you request a statistic to print above each bar with the GCHART procedure, a message might be displayed in the SAS log stating that the values are wider than the bars. When this happens, you can use the Annotate facility to circumvent the problem.
The sample code on the Full Code tab provides an illustration.
These sample files and code examples are provided by SAS Institute Inc. "as is" without warranty of any kind, either express or implied, including but not limited to the implied warranties of merchantability and fitness for a particular purpose. Recipients acknowledge and agree that SAS Institute shall not be liable for any damages whatsoever arising out of their use of this material. In addition, SAS Institute will provide no support for the materials contained herein.
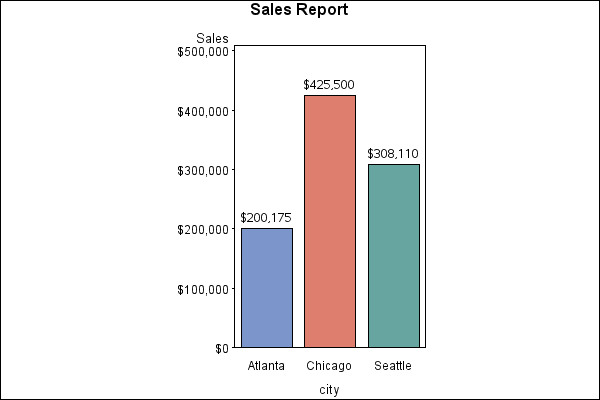
If you request a statistic to print above each bar with PROC GCHART, a message might be displayed in the SAS Log stating that the values are wider than the bars. When this happens, you can use the Annotate facility to circumvent the problem.
The graphics output on the Results tab was produced using SAS® 9.2. Submitting the sample code with releases of SAS prior to SAS 9.2 might produce different results.
 /* Set the graphics environment */
goptions reset=all border cback=white htitle=12pt htext=10pt;

 /* Create input data set SOLD */
data sold;
   input city $ sales comma7.;
   datalines;
Atlanta 200,175
Chicago 425,500
Seattle 308,110
;
run;

 /* Create the Annotate data set ANNO */
data anno;
   length function color text $ 8 style $ 20;
   retain function 'label' color 'black' when 'a'
          xsys ysys '2' position '2' size 3 hsys '3';
   set sold;
   style="'Albany AMT'";
   midpoint=city;
   text=left(put(sales,dollar8.));
   y=sales;
run;

 /* Add a title to the graph */
title 'Sales Report';

axis1 minor=none label=('Sales');

 /* Produce the bar chart */
proc gchart data=sold;
   vbar city / sumvar=sales anno=anno
               raxis=axis1 patternid=midpoint;
   format sales dollar8.;
run;
quit;
These sample files and code examples are provided by SAS Institute Inc. "as is" without warranty of any kind, either express or implied, including but not limited to the implied warranties of merchantability and fitness for a particular purpose. Recipients acknowledge and agree that SAS Institute shall not be liable for any damages whatsoever arising out of their use of this material. In addition, SAS Institute will provide no support for the materials contained herein.
If you request a statistic to print above each bar with PROC GCHART, a message might be displayed in the SAS® log stating that the values are wider than the bars. When this happens, you can use the Annotate facility to circumvent the problem.
| Type: | Sample |
| Topic: | SAS Reference ==> Procedures ==> GCHART Query and Reporting ==> Creating Reports ==> Graphical ==> Graph Elements ==> Annotation Query and Reporting ==> Creating Reports ==> Graphical ==> Graph Types ==> Charts ==> Bar |
| Date Modified: | 2005-08-24 16:06:29 |
| Date Created: | 2004-11-11 11:07:55 |
Operating System and Release Information
| Product Family | Product | Host | SAS Release | |
| Starting | Ending | |||
| SAS System | SAS/GRAPH | All | n/a | n/a |