Sample 24882: Display multiple lines of text for axis values with PROC GCHART
The sample code on the Full Code tab uses PROC GCHART and the SPLIT= option in an AXIS statement to specify the split character to be used to display multiple lines of text for axis values.
These sample files and code examples are provided by SAS Institute
Inc. "as is" without warranty of any kind, either express or implied, including
but not limited to the implied warranties of merchantability and fitness for a
particular purpose. Recipients acknowledge and agree that SAS Institute shall
not be liable for any damages whatsoever arising out of their use of this material.
In addition, SAS Institute will provide no support for the materials contained herein.
This sample uses the SPLIT= option in an AXIS statement to specify the split character to be used to automatically place multiple lines of text for axis values.
The graphics output in the Results tab was produced using SAS® 9.2. Submitting the sample code with releases of SAS prior to SAS 9.2 might produce different results.
 /* Set the graphics environment */
goptions reset=all border cback=white htitle=12pt;

 /* Define a data set for charting */
data a;
   input PRODUCT $15. SALES;
   datalines;
Tennis,Shoes    27
Tennis,Shorts   10
Running,Shoes   68
Running,Shorts  61
;
run;

 /* Use the SPLIT= option to split each axis value at the "," and  */
 /* center-justify each value.                                     */
 /* Note: The split character does not have to be a comma, and it  */
 /* will not show in the axis value on the graph.                  */
axis1 split="," value=(justify=c angle=0) label=none;
axis2 minor=none label=('SALES');

title1 'Multiple line axis values using the SPLIT= option';

 /* Produce the chart */
proc gchart data=a;
   vbar product / sumvar=sales maxis=axis1 raxis=axis2 descending;
run;
quit;
These sample files and code examples are provided by SAS Institute
Inc. "as is" without warranty of any kind, either express or implied, including
but not limited to the implied warranties of merchantability and fitness for a
particular purpose. Recipients acknowledge and agree that SAS Institute shall
not be liable for any damages whatsoever arising out of their use of this material.
In addition, SAS Institute will provide no support for the materials contained herein.
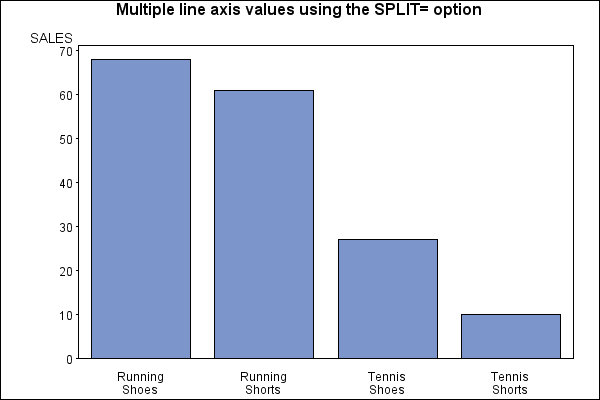
This sample uses PROC GCHART and the SPLIT option on an AXIS statement to specify the split character to be used to display multiple lines of text for axis values.
| Type: | Sample |
| Topic: | SAS Reference ==> Procedures ==> GCHART
Query and Reporting ==> Creating Reports ==> Graphical ==> Graph Types ==> Charts ==> Bar
|
| Date Modified: | 2005-08-24 16:06:28 |
| Date Created: | 2004-11-11 11:07:54 |
Operating System and Release Information
| SAS System | SAS/GRAPH | All | n/a | n/a |


