Sample 24872: Produce one standard error with the ERRORBAR option with PROC GCHART
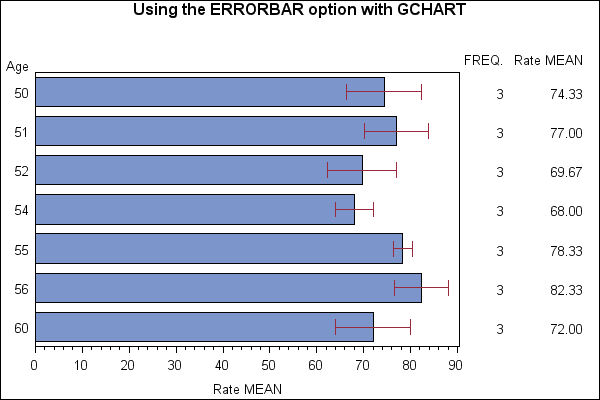
This sample code uses the ERRORBAR option on the HBAR statement of PROC GCHART to display error bars representing one standard error.
These sample files and code examples are provided by SAS Institute
Inc. "as is" without warranty of any kind, either express or implied, including
but not limited to the implied warranties of merchantability and fitness for a
particular purpose. Recipients acknowledge and agree that SAS Institute shall
not be liable for any damages whatsoever arising out of their use of this material.
In addition, SAS Institute will provide no support for the materials contained herein.
This sample code uses the ERRORBAR option on the HBAR statement of PROC GCHART to display error bars representing one standard error.
The graphics output in the Results tab was produced using SAS® 9.2. Submitting
the sample code with releases of SAS prior to SAS 9.2 might produce different results.
 /* Set the graphics environment */
goptions reset=all cback=white border htitle=12pt htext=10pt;

 /* Create the input data set SOLD */
data sold;
   input Age 1-2 Rate 4-6;
   datalines;
50 60
50 88
50 75
51 74
51 90
51 67
52 55
52 76
52 78
54 63
54 65
54 76
55 82
55 75
55 78
56 87
56 89
56 71
60 60
60 87
60 69
;
run;

/* The ERRORBAR= option draws confidence intervals on a horizontal    */
/* or vertical bar chart for either: The mean of the SUMVAR= variable */
/* for each midpoint if you specify TYPE=MEAN.  The percentage of     */
/* observations assigned to each midpoint if you specify TYPE=PCT     */
/* with no SUMVAR= option.  ERRORBAR=BOTH draws error bars as two     */
/* ticks joined by a line.  The default value for the CLM= option is  */
/* 95%.  By default, CLM= draws the intervals using ERRORBAR=BOTH.    */

/* If you want the error bars to represent a given number C of standard */
/* errors instead of a confidence interval, and if the number of        */
/* observations assigned to each midpoint is the same, then you can     */
/* find the appropriate value for the CLM= option by running a DATA     */
/* step.                                                                */

data _null_;                                /* If you want error bars that      */
  c=1;                                      /* represent one standard           */
  n=3;                                      /* error (C=1) with a sample        */
  level=100 * (1 - 2 * (1 - PROBT(C,N-1))); /* size on N, you can compute       */
  call symput('level', put(level,best12.)); /* the appropriate value for        */
run;                                        /* CLM= option and assign that      */
                                            /* value to a macro variable &LEVEL */
 /* Add a title to the graph */
title1 'Using the ERRORBAR option with GCHART';

 /* Create the graph using the ERRORBAR option */
 /* on the HBAR statement.                     */
proc gchart data=sold;
   hbar age / type=mean sumvar=rate discrete frame
              errorbar=both clm=&level cerror=depk;
run;
quit;
These sample files and code examples are provided by SAS Institute
Inc. "as is" without warranty of any kind, either express or implied, including
but not limited to the implied warranties of merchantability and fitness for a
particular purpose. Recipients acknowledge and agree that SAS Institute shall
not be liable for any damages whatsoever arising out of their use of this material.
In addition, SAS Institute will provide no support for the materials contained herein.
This sample code uses the ERRORBAR option on the HBAR statement of PROC GCHART to display error bars representing one standard error.
| Type: | Sample |
| Topic: | SAS Reference ==> Procedures ==> GCHART
Query and Reporting ==> Creating Reports ==> Graphical ==> Graph Types ==> Charts ==> Bar
|
| Date Modified: | 2005-08-24 16:06:26 |
| Date Created: | 2004-11-11 11:07:53 |
Operating System and Release Information
| SAS System | SAS/GRAPH | All | n/a | n/a |


