Sample 24865: Overlay a plot line on a vertical bar chart
 |  |  |  |  |
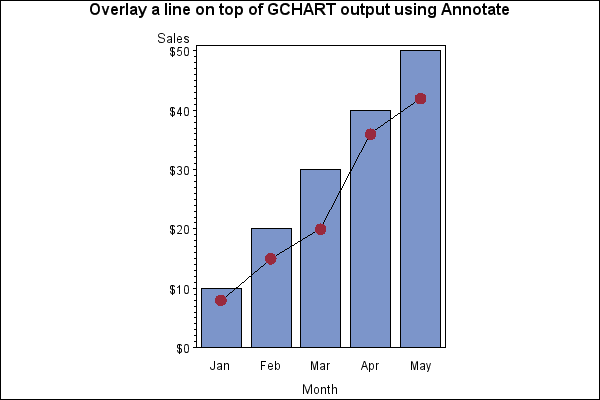
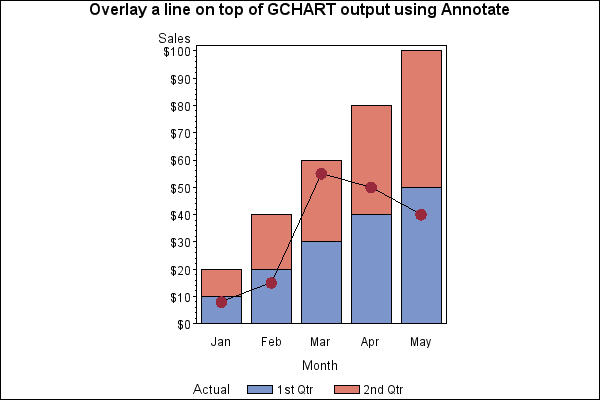
This example consists of two separate programs, both of which use the Annotate facility to overlay a plot line on a bar chart. The first example overlays a line on a non-stacked bar chart, while the second example overlays a line on a stacked bar chart.
These sample files and code examples are provided by SAS Institute Inc. "as is" without warranty of any kind, either express or implied, including but not limited to the implied warranties of merchantability and fitness for a particular purpose. Recipients acknowledge and agree that SAS Institute shall not be liable for any damages whatsoever arising out of their use of this material. In addition, SAS Institute will provide no support for the materials contained herein.
This example consists of two separate programs, both of which use the Annotate facility to overlay a plot line on a bar chart. The first example overlays a line on a non-stacked bar chart, while the second example overlays a line on a stacked bar chart.
The graphics output in the Results tab was produced using SAS® 9.2. Submitting the sample code with releases of SAS prior to SAS 9.2 might produce different results.
 /* Example 1 */

 /* Set the graphics environment */
goptions reset=all border cback=white htitle=12pt;

 /* Create input data set A for Example 1 */
data a;
   input Xvar mmddyy6. Vbar_Y Plot_Y;
   datalines;
010196 10 8
020196 20 15
030196 30 20
040196 40 36
050196 50 42
;
run;

 /* The next few lines in the ANNO DATA step create the plot line that   */
 /* will overlay the bar chart.  XSYS and YSYS are the coordinate system */
 /* variables used to position the X and Y values.  The annotate data    */
 /* set will use one MOVE function for the first observation, then       */
 /* it will use the DRAW function to draw each line segment from one     */
 /* bar to the next.                                                     */

data anno;
   length function color $ 8 text $ 10;
   retain xsys ysys '2' when 'a';
   set a end=last;

   if _n_ = 1 then function='move';
   else function='draw';
   xsys='2'; ysys='2';
   x=xvar; y=plot_y;
   output;

   function='symbol';
   xsys='2'; ysys='2';
   x=xvar; y=plot_y;
   text='dot'; size=2; color='depk';
   output;
run;

 /* Customize the axes */
axis1 label=('Month');
axis2 label=('Sales');

title1 'Overlay a line on top of GCHART output using Annotate';

 /* Produce the chart */
proc gchart data=a;
   vbar xvar / sumvar=vbar_y anno=anno width=8
               midpoints='01jan96'd to '01may96'd by month
               maxis=axis1 raxis=axis2;
   format xvar monname3.;
   format vbar_y dollar6.;
run;
quit;

 /* Example 2 */

 /* Set the graphics environment */
goptions reset=all border cback=white htitle=12pt;

 /* Create input data set, A for Example 2 */
data a;
   input Subvar $ Xvar mmddyy6. Vbar_Y Plot_Y;
   datalines;
sub1 010196 10 8
sub1 020196 20 15
sub1 030196 30 55
sub1 040196 40 50
sub1 050196 50 40
sub2 010196 10 8
sub2 020196 20 15
sub2 030196 30 55
sub2 040196 40 50
sub2 050196 50 40
;
run;

 /* The next few lines in the ANNO DATA step create the plot line that   */
 /* will overlay the bar chart.  XSYS and YSYS are the coordinate system */
 /* variables used to position the X and Y values.  The annotate data    */
 /* set will use one MOVE function for the first observation, then       */
 /* it will use the DRAW function to draw each line segment from one     */
 /* bar to the next.                                                     */

data anno;
   length function color  $8 text $10;
   retain xsys ysys '2'  when 'a';

   set a end=last;
   by subvar;

   if first.subvar then function='move';
   else function='draw';
   x=xvar; y=plot_y;
   size=1;
   color='black'; output;

   function='symbol';
   xsys='2'; ysys='2';
   x=xvar; y=plot_y;
   text='dot'; size=2; color='depk';
   output;
run;

 /* Customize the axes */
axis1 label=('Month');
axis2 label=('Sales');

 /* Customize the legend */
legend1 label=('Actual') value=('1st Qtr' '2nd Qtr');

title1 'Overlay a line on top of GCHART output using Annotate';

 /* Produce the chart */
proc gchart data=a;
   vbar xvar / sumvar=vbar_y anno=anno width=8
               midpoints='01jan96'd to '01may96'd by month
               subgroup=subvar maxis=axis1 raxis=axis2
               legend=legend1;

   format xvar monname3.;
   format vbar_y dollar6.;
run;
quit;
These sample files and code examples are provided by SAS Institute Inc. "as is" without warranty of any kind, either express or implied, including but not limited to the implied warranties of merchantability and fitness for a particular purpose. Recipients acknowledge and agree that SAS Institute shall not be liable for any damages whatsoever arising out of their use of this material. In addition, SAS Institute will provide no support for the materials contained herein.
This example consists of two separate programs, both of which use the Annotate facility to overlay a plot line on a bar chart. The first example overlays a line on a non-stacked bar chart, while the second example overlays a line on a stacked bar chart.
| Type: | Sample |
| Topic: | Query and Reporting ==> Creating Reports ==> Graphical ==> Graph Elements ==> Annotation SAS Reference ==> Procedures ==> GCHART Query and Reporting ==> Creating Reports ==> Graphical ==> Graph Types ==> Charts ==> Bar |
| Date Modified: | 2005-08-24 16:06:25 |
| Date Created: | 2004-11-11 11:07:52 |
Operating System and Release Information
| Product Family | Product | Host | SAS Release | |
| Starting | Ending | |||
| SAS System | SAS/GRAPH | All | n/a | n/a |