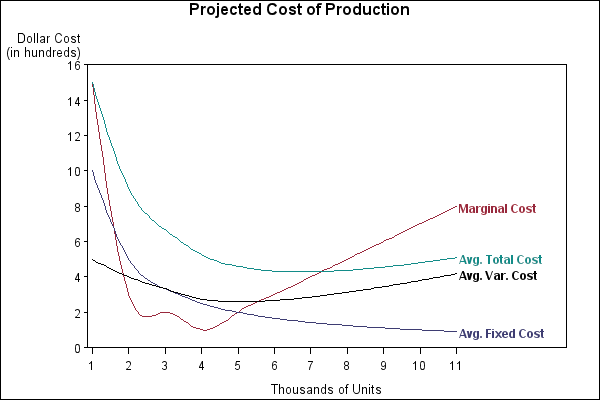
Sample 24837: Label plot lines in an overlay plot using PROC GPLOT with Annotate
The sample code on the Full Code tab uses PROC GPLOT with the Annotate facility to label individual plot lines.
These sample files and code examples are provided by SAS Institute
Inc. "as is" without warranty of any kind, either express or implied, including
but not limited to the implied warranties of merchantability and fitness for a
particular purpose. Recipients acknowledge and agree that SAS Institute shall
not be liable for any damages whatsoever arising out of their use of this material.
In addition, SAS Institute will provide no support for the materials contained herein.
This sample uses PROC GPLOT with the Annotate facility to label individual plot lines.
The graphics output in the Results tab was produced using SAS® 9.2. Submitting the sample code with releases of SAS prior to SAS 9.2 might produce different results.
 /* Set the graphics environment */
goptions reset=all cback=white border htitle=12pt;

 /* Create input data set, PRODCOST */
data prodcost (drop=tcprev tfc tvc tc);
   retain tcprev 0;
   input quan tfc tvc;
   tc=tfc+tvc;
   afc=tfc/quan;       /* average fixed cost    */
   avc=tvc/quan;       /* average variable cost */
   atc=tc/quan;        /* average total cost    */
   mc=tc-tcprev;       /* marginal cost         */
   tcprev=tc;
   datalines;
1    10   05
2    10   08
3    10   10
4    10   11
5    10   13
6    10   16
7    10   20
8    10   25
9    10   31
10   10   38
11   10   46
;
run;

 /* Create the Annotate data set LINETEXT */
data linetext(drop=afc atc avc mc quan);
   length function color $ 8 text $ 20 style $ 25;
   retain function 'label' xsys ysys '2' hsys '3' position '6'
          size 3;

   set prodcost end=last;
   style = "'Albany AMT/bold'";
   if last then do;
      x=quan;
      y=mc;  text=' Marginal Cost';   color='depk';  output;
      y=atc; text=' Avg. Total Cost'; color='vibg';  output;
      y=afc; text=' Avg. Fixed Cost'; color='mob';   output;
      y=avc; text=' Avg. Var. Cost';  color='black'; output;
   end;
run;

 /* Add a title to the graph */
title1 'Projected Cost of Production';
footnote1 height=2 angle=90 ' ';

 /* Create axis definitions */
axis1 minor=none offset=(1,22)
      label=('Thousands of Units');
axis2 order=(0 to 16 by 2) minor=none offset=(0,0)
      label=('Dollar Cost' justify=right '(in hundreds)');

 /* Choose the interpolation method and assign symbol characteristics */
symbol1 interpol=spline width=1 color=depk;
symbol2 interpol=spline width=1 color=vibg;
symbol3 interpol=spline width=1 color=mob;
symbol4 interpol=spline width=1 color=black;

 /* Produce the plot */
proc gplot data=prodcost;
   plot (mc atc afc avc)*quan / overlay frame
                                haxis=axis1 vaxis=axis2
                                annotate=linetext;
run;
quit;
These sample files and code examples are provided by SAS Institute
Inc. "as is" without warranty of any kind, either express or implied, including
but not limited to the implied warranties of merchantability and fitness for a
particular purpose. Recipients acknowledge and agree that SAS Institute shall
not be liable for any damages whatsoever arising out of their use of this material.
In addition, SAS Institute will provide no support for the materials contained herein.
This sample uses PROC GPLOT with the Annotate facility to label individual plot lines.
| Type: | Sample |
| Topic: | SAS Reference ==> Procedures ==> GPLOT
Query and Reporting ==> Creating Reports ==> Graphical ==> Graph Types ==> Plots ==> Line
Query and Reporting ==> Creating Reports ==> Graphical ==> Graph Elements ==> Annotation
|
| Date Modified: | 2007-10-15 07:31:19 |
| Date Created: | 2004-10-15 11:01:03 |
Operating System and Release Information
| SAS System | SAS/GRAPH | All | n/a | n/a |


