| Exploring Data in Three Dimensions |
Contour Plots of Selected Variables
If one or more interval variables are selected in a data table when
you select Graph ![]() Contour Plot, then the contour plot
dialog box (Figure 7.15) does not appear. Instead,
the first selected variable is used as the Z variable.
Contour plots are created for Z as a function of each pair of
remaining interval variables.
Contour Plot, then the contour plot
dialog box (Figure 7.15) does not appear. Instead,
the first selected variable is used as the Z variable.
Contour plots are created for Z as a function of each pair of
remaining interval variables.
If you create a matrix of plots from selected variables, you can close the matrix by pressing the F11 key while any plot is active and selecting from the pop-up menu. Alternatively, you can use the Workspace Explorer (see the section "Workspace Explorer") to quickly close plots.
Variables with a Frequency or Weight role are ignored when you are creating contour plots.
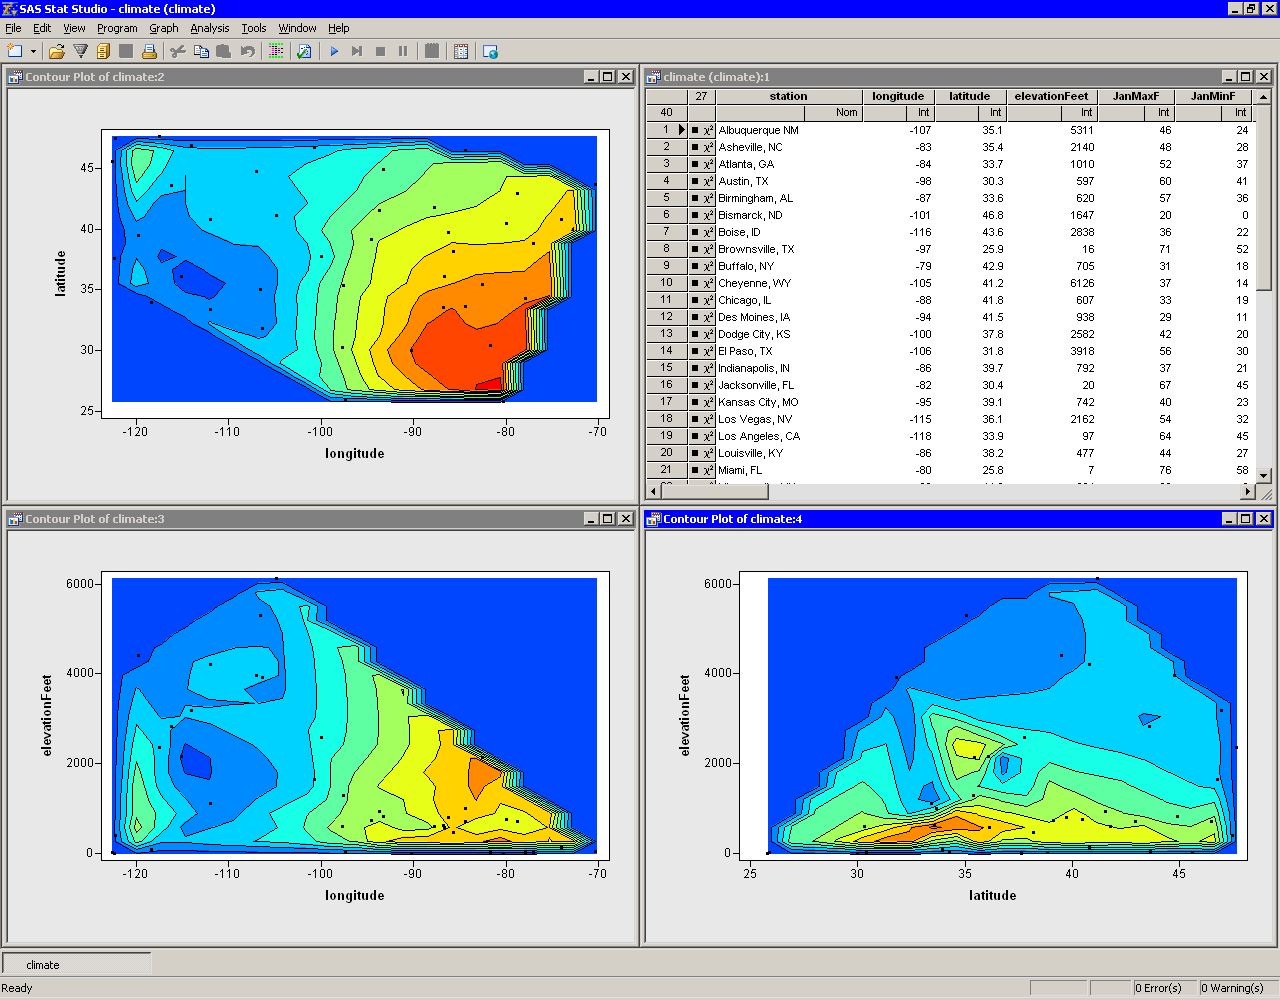
Figure 7.25 shows a matrix of contour plots for four
selected variables. The TotalAvePrecipIn variable is plotted as
a function of longitude, latitude, and elevationFeet.
|
Figure 7.25: A Matrix of Contour Plots
Copyright © 2008 by SAS Institute Inc., Cary, NC, USA. All rights reserved.