| Plotting Subsets of Data |
Changing Marker Properties
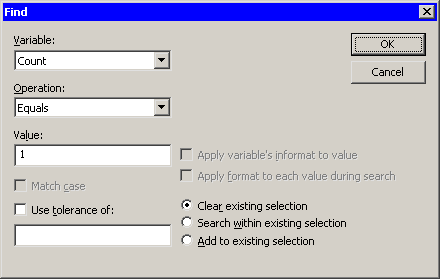
The following steps select observations where Count=1 and change the shape and color of those observations.
| Select Edit |
| Fill out the dialog box to find observations where Count equals 1, as shown in Figure 12.11. Click OK. |
|
Figure 12.11: The Find Dialog Box
| Select Edit |
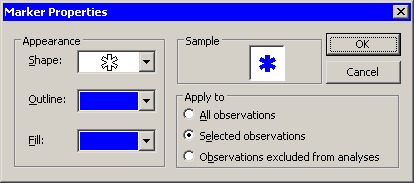
The Marker Properties dialog box appears, as shown in Figure 12.12.
|
Figure 12.12: The Marker Properties Dialog Box
| Change Shape to a star (
|
The observations with Count=1 are now selected and represented by blue star-shaped markers.
Copyright © 2008 by SAS Institute Inc., Cary, NC, USA. All rights reserved.