| Plotting Subsets of Data |
Creating an Indicator Variable
There is an easy way to create a variable that enumerates the observations for each cyclone by using the DATA step. That is the approach taken in this section.
The following steps use the Variable Transformation Wizard to create the indicator variable. See "Custom Transformations" for details on the Variable Transformation Wizard.
| Select Analysis |
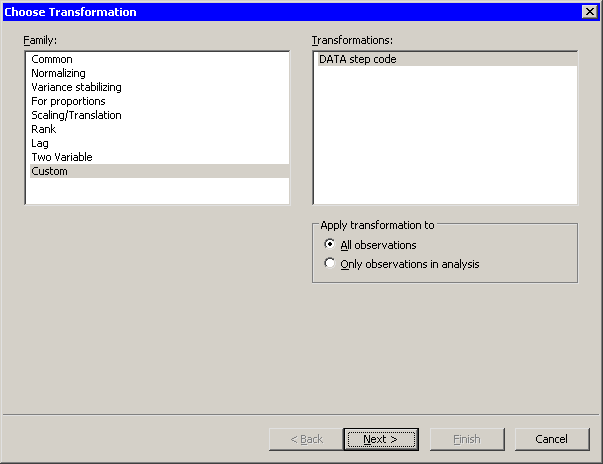
The Variable Transformation Wizard appears, as shown in
Figure 12.8.
|
Figure 12.8: Selecting a Custom Transformation
| Select Custom from the Family list and click Next. |
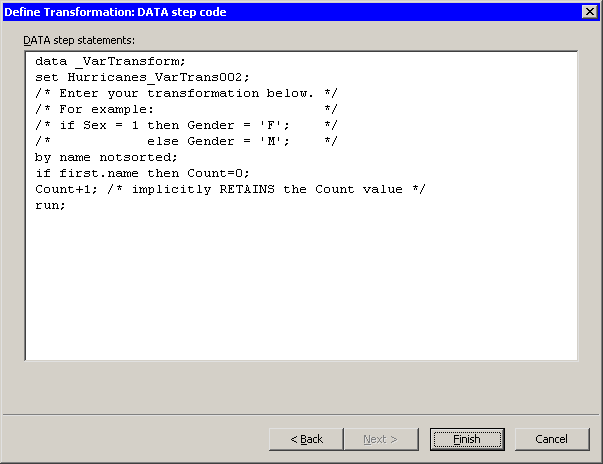
The second page of the wizard provides a window for you to enter DATA step code.
| Type in the following DATA step code, prior to the RUN statement, as shown in Figure 12.9. |
    by name notsorted;
    if first.name then Count=0;
    Count+1; /* implicitly RETAINS the Count value */
|
Figure 12.9: Entering DATA Step Code
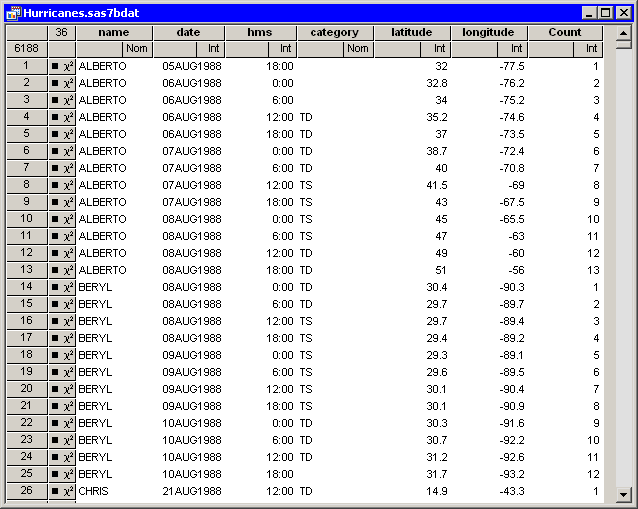
| Click Finish. |
A new variable, Count, is added to the data table. The variable
enumerates the observations for each cyclone. In particular,
Count=1 indicates the first observation for each cyclone.
Figure 12.10 shows the new variable. (Some variables in
the table are hidden.)
|
Figure 12.10: Hurricane Data With a New Variable
Copyright © 2008 by SAS Institute Inc., Cary, NC, USA. All rights reserved.