| Plotting Subsets of Data |
Creating BY Group Plots
The last part of this example is the same as for the previous example.
| Select Graph |
| Select the latitude variable and click Set Y. Select the longitude variable and click Set X. |
| Click the BY Variables tab. |
| Scroll down in the list of variables and select the month variable. Click Add BY. |
The BY Options tab should be populated with your choices from the previous example.
| Click OK. |
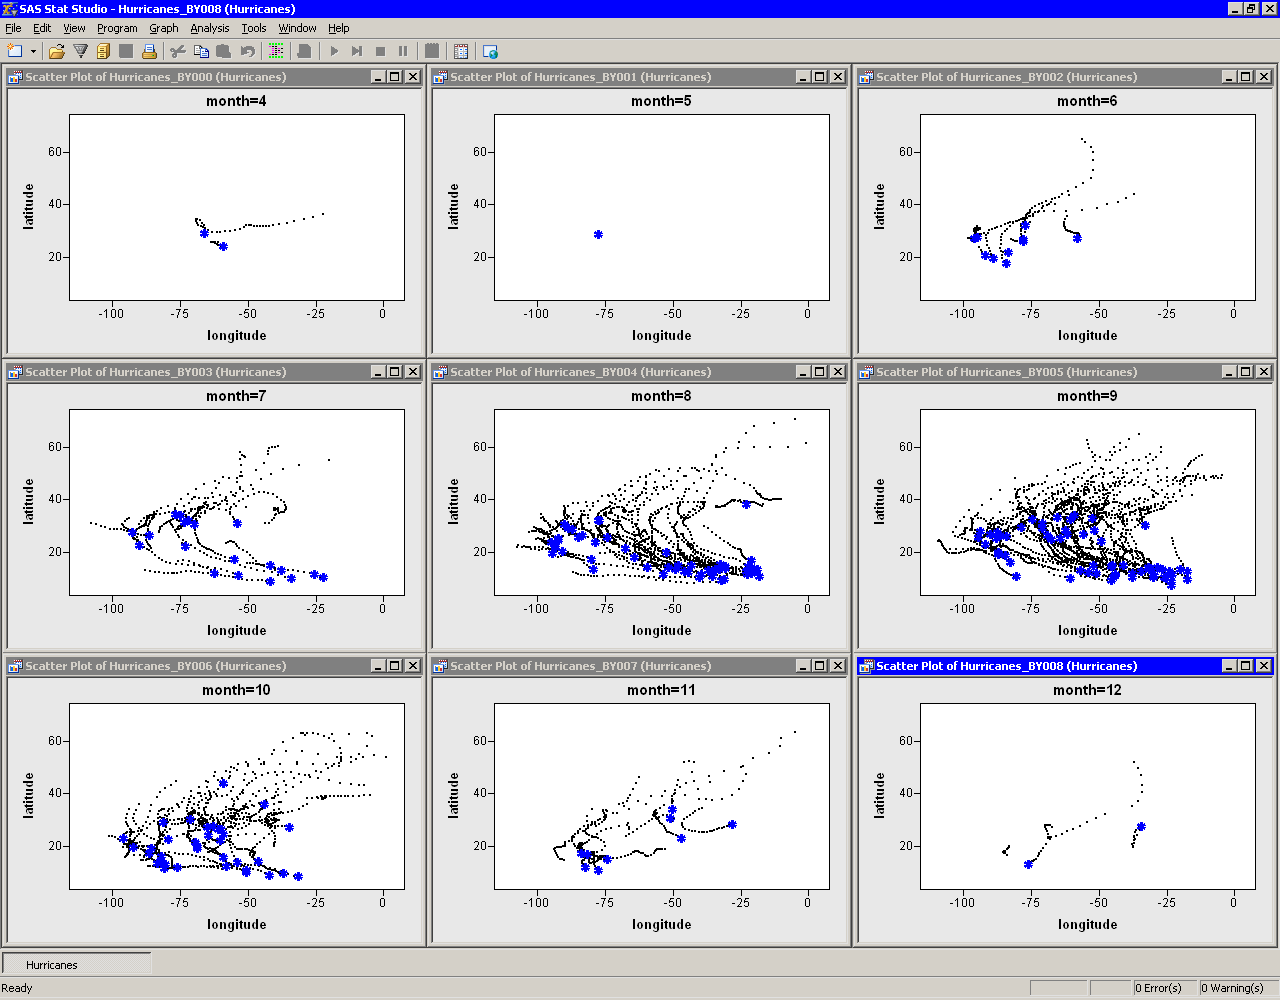
Nine scatter plots appear, one for each month 4 - 12, as shown
in Figure 12.13.
|
Figure 12.13: Scatter Plots of Location by Month
Note that marker properties such as color, shape, and selected status
are copied to each of the BY groups. In particular, the selected blue
stars enable you to see the origin of each cyclone.
A few new features of the data are apparent.
- The origin of cyclones varies with the month.
- Cyclones early in the season (May - June) and late in the season (October - November) often originate in the Gulf of Mexico (81 - 98 degrees west longitude and 18 - 30 degrees north latitude) or Caribbean Sea
- In August and September quite a few Cape Verde-type cyclones are apparent. Cape Verde-type cyclones originate between the Cape Verde islands (23 degrees west longitude and 15 degrees north latitude) and the Lesser Antilles (60 degrees west longitude).
- A large number of cyclones originate in the mid-Atlantic (25 - 35 degrees north latitude) in September, although mid-Atlantic origins are also seen in other months.
The next section describes how you can use the Workspace Explorer to view, hide, close, and compare BY-group plots.
Copyright © 2008 by SAS Institute Inc., Cary, NC, USA. All rights reserved.