The NPAR1WAY Procedure

This example uses the SAS data set Arthritis created in Example 71.1. The data set contains the variable Treatment, which denotes the treatment received by a patient, and the variable Response, which contains the response status of the patient. The variable Freq contains the frequency of the observation, which is the number of patients with the Treatment and Response combination.
The following statements request empirical distribution function (EDF) statistics, which test whether the distribution of
a variable is the same across different groups. The EDF option requests the EDF analysis. The variable Treatment is the CLASS variable, and the variable Response specified in the VAR statement is the analysis variable. The FREQ statement names Freq as the frequency variable.
The PLOTS= option requests an EDF plot for Response classified by Treatment. ODS Graphics must be enabled before producing plots.
ods graphics on;
proc npar1way edf plots=edfplot data=Arthritis;
   class Treatment;
   var Response;
   freq Freq;
run;
ods graphics off;
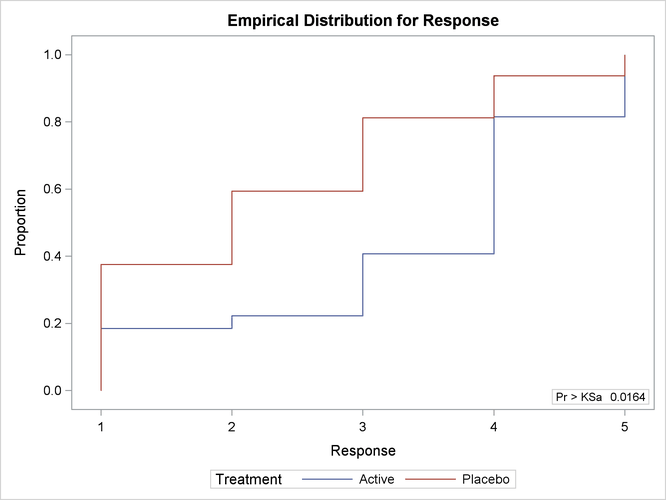
Output 71.2.1 shows EDF statistics that compare the two levels of Treatment, Active and Placebo. The asymptotic p-value for the Kolmogorov-Smirnov test is 0.0164. This supports rejection of the null hypothesis that the distributions are
the same for the two samples.
Output 71.2.2 shows the EDF plot for Response classified by Treatment.
Output 71.2.1: Empirical Distribution Function Statistics
| Kolmogorov-Smirnov Test for Variable Response Classified by Variable Treatment |
|||
|---|---|---|---|
| Treatment | N | EDF at Maximum |
Deviation from Mean at Maximum |
| Active | 27 | 0.407407 | -1.141653 |
| Placebo | 32 | 0.812500 | 1.048675 |
| Total | 59 | 0.627119 | |
| Maximum Deviation Occurred at Observation 3 | |||
| Value of Response at Maximum = 3.0 | |||