The NPAR1WAY Procedure

Fifty-nine female patients with rheumatoid arthritis who participated in a clinical trial were assigned to two groups, active and placebo. The response status (excellent=5, good=4, moderate=3, fair=2, poor=1) of each patient was recorded.
The following SAS statements create the data set Arthritis, which contains the observed status values for all the patients. The variable Treatment denotes the treatment received by a patient, and the variable Response contains the response status of the patient. The variable Freq contains the frequency of the observation, which is the number of patients with the Treatment and Response combination.
data Arthritis;
   input Treatment $ Response Freq @@;
   datalines;
Active 5 5 Active 4 11 Active 3 5 Active 2 1 Active 1 5
Placebo 5 2 Placebo 4 4 Placebo 3 7 Placebo 2 7 Placebo 1 12
;
The following PROC NPAR1WAY statements test the null hypothesis that there is no difference in the patient response status
against the alternative hypothesis that the patient response status differs in the two treatment groups. The WILCOXON option
requests the Wilcoxon test for difference in location, and the MEDIAN option requests the median test for difference in location.
The variable Treatment is the CLASS variable, and the VAR statement specifies that the variable Response is the analysis variable.
The PLOTS= option requests a box plot of the Wilcoxon scores and a median plot for Response classified by Treatment. ODS Graphics must be enabled before producing plots.
ods graphics on;
proc npar1way data=Arthritis wilcoxon median
              plots=(wilcoxonboxplot medianplot);
   class Treatment;
   var Response;
   freq Freq;
run;
ods graphics off;
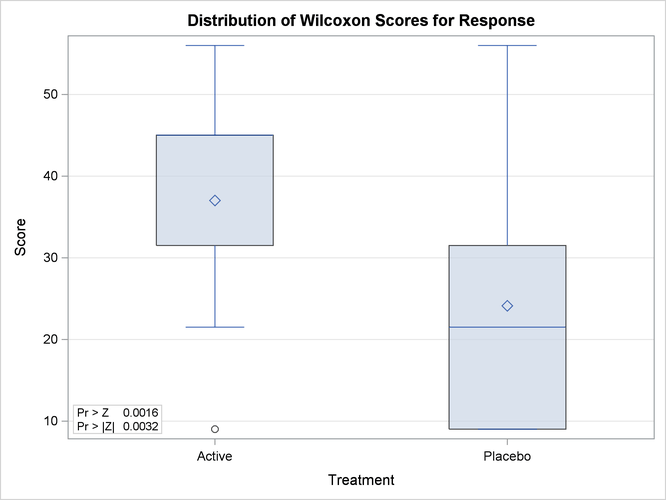
Output 71.1.1 shows the results of the Wilcoxon analysis. The Wilcoxon two-sample test statistic equals 999.0, which is the sum of the Wilcoxon scores for the smaller sample (Active). This sum is greater than 810.0, which is the expected value under the null hypothesis of no difference between the two samples, Active and Placebo. The one-sided p-value is 0.0016, which indicates that the patient response for the Active treatment is significantly more than for the Placebo group.
Output 71.1.2 displays the box plot of Wilcoxon scores classified by Treatment, which corresponds to the Wilcoxon analysis in Output 71.1.1. To remove the p-values from the box plot display, you can specify the NOSTATS plot option in parentheses after the WILCOXONBOXPLOT option.
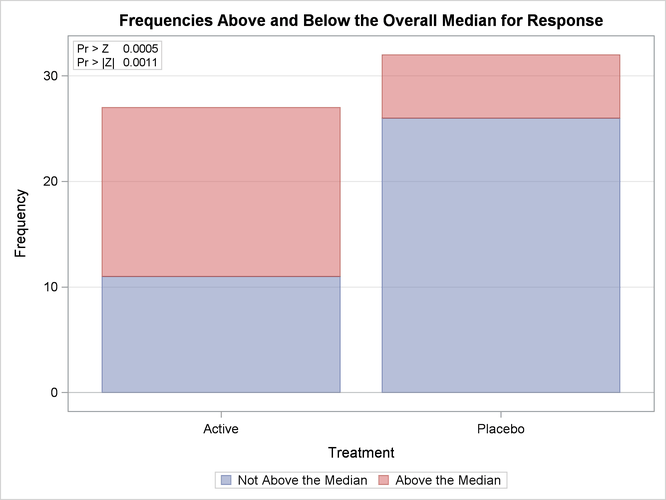
Output 71.1.3 shows the results of the median two-sample test. The test statistic equals 18.9167, and its standardized Z value is 3.2667. The one-sided p-value Pr > Z equals 0.0005. This supports the alternative hypothesis that the effect of the Active treatment is greater than that of the Placebo.
Output 71.1.4 displays the median plot for the analysis of Response classified by Treatment. The median plot is a stacked bar chart showing the frequencies above and below the overall median. This plot corresponds
to the median scores analysis in Output 71.1.3.