The FASTCLUS Procedure

Example 36.2 Outliers
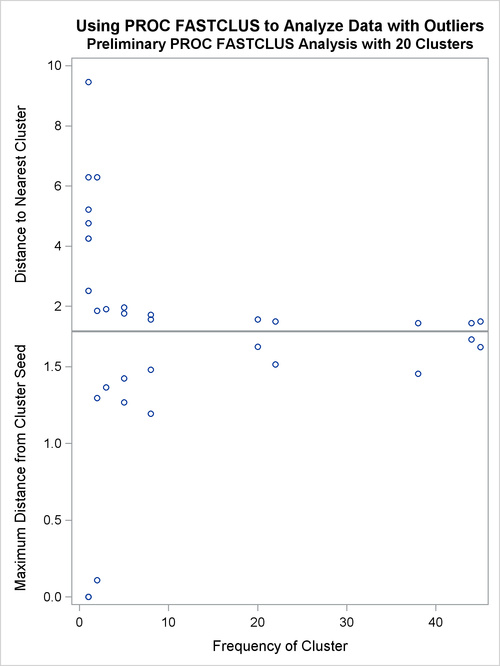
This example involves data artificially generated to contain two clusters and several severe outliers. A preliminary analysis specifies 20 clusters and outputs an OUTSEED= data set to be used for a diagnostic plot. The exact number of initial clusters is not important; similar results could be obtained with 10 or 50 initial clusters. Examination of the plot suggests that clusters with more than five (again, the exact number is not important) observations can yield good seeds for the main analysis. A DATA step deletes clusters with five or fewer observations, and the remaining cluster means provide seeds for the next PROC FASTCLUS analysis.
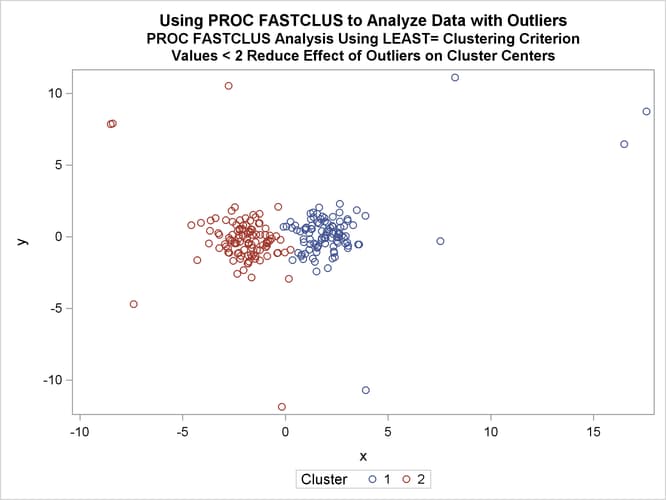
Two clusters are requested; the LEAST= option specifies the mean absolute deviation criterion (LEAST=1). Values of the LEAST= option less than 2 reduce the effect of outliers on cluster centers.
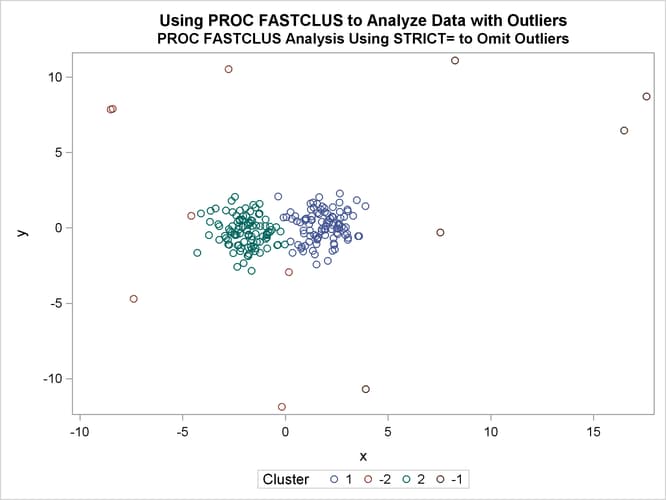
The next analysis also requests two clusters; the STRICT= option is specified to prevent outliers from distorting the results.
The STRICT= value is chosen to be close to the _GAP_ and _RADIUS_ values of the larger clusters in the diagnostic plot; the exact value is not critical.
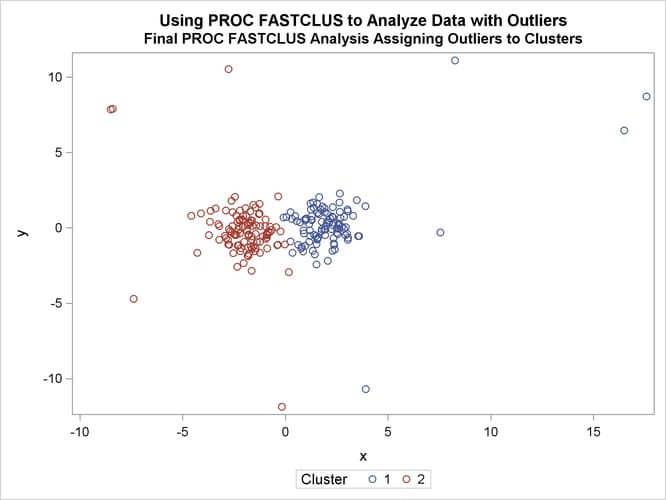
A final PROC FASTCLUS run assigns the outliers to clusters.
The following SAS statements implement these steps, and the results are displayed in Output 36.2.3 through Output 36.2.8. First, an artificial data set is created with two clusters and some outliers. Then PROC FASTCLUS is run with many clusters
to produce an OUTSEED= data set. A diagnostic plot using the variables _GAP_ and _RADIUS_ is then produced using the SGSCATTER procedure. The results from these steps are shown in Output 36.2.1 and Output 36.2.2.
title 'Using PROC FASTCLUS to Analyze Data with Outliers';
data x;
   drop n;
   do n=1 to 100;
      x=rannor(12345)+2;
      y=rannor(12345);
      output;
   end;
   do n=1 to 100;
      x=rannor(12345)-2;
      y=rannor(12345);
      output;
   end;
   do n=1 to 10;
      x=10*rannor(12345);
      y=10*rannor(12345);
      output;
   end;
run;

title2 'Preliminary PROC FASTCLUS Analysis with 20 Clusters';
proc fastclus data=x outseed=mean1 maxc=20 maxiter=0 summary;
   var x y;
run;

proc sgscatter data=mean1;
   compare y=(_gap_ _radius_) x=_freq_;
run;
Output 36.2.1: Preliminary Analysis of Data with Outliers Using PROC FASTCLUS
| Using PROC FASTCLUS to Analyze Data with Outliers |
| Preliminary PROC FASTCLUS Analysis with 20 Clusters |
| Criterion Based on Final Seeds = | 0.6873 |
|---|
| Cluster Summary | ||||||
|---|---|---|---|---|---|---|
| Cluster | Frequency | RMS Std Deviation | Maximum Distance from Seed to Observation |
Radius Exceeded |
Nearest Cluster | Distance Between Cluster Centroids |
| 1 | 8 | 0.4753 | 1.1924 | 19 | 1.7205 | |
| 2 | 1 | . | 0 | 6 | 6.2847 | |
| 3 | 44 | 0.6252 | 1.6774 | 5 | 1.4386 | |
| 4 | 1 | . | 0 | 20 | 5.2130 | |
| 5 | 38 | 0.5603 | 1.4528 | 3 | 1.4386 | |
| 6 | 2 | 0.0542 | 0.1085 | 2 | 6.2847 | |
| 7 | 1 | . | 0 | 14 | 2.5094 | |
| 8 | 2 | 0.6480 | 1.2961 | 1 | 1.8450 | |
| 9 | 1 | . | 0 | 7 | 9.4534 | |
| 10 | 1 | . | 0 | 18 | 4.2514 | |
| 11 | 1 | . | 0 | 16 | 4.7582 | |
| 12 | 20 | 0.5911 | 1.6291 | 16 | 1.5601 | |
| 13 | 5 | 0.6682 | 1.4244 | 3 | 1.9553 | |
| 14 | 1 | . | 0 | 7 | 2.5094 | |
| 15 | 5 | 0.4074 | 1.2678 | 3 | 1.7609 | |
| 16 | 22 | 0.4168 | 1.5139 | 19 | 1.4936 | |
| 17 | 8 | 0.4031 | 1.4794 | 5 | 1.5564 | |
| 18 | 1 | . | 0 | 10 | 4.2514 | |
| 19 | 45 | 0.6475 | 1.6285 | 16 | 1.4936 | |
| 20 | 3 | 0.5719 | 1.3642 | 15 | 1.8999 | |
| Pseudo F Statistic = | 207.58 |
|---|
| Observed Over-All R-Squared = | 0.95404 |
|---|
| Approximate Expected Over-All R-Squared = | 0.96103 |
|---|
| Cubic Clustering Criterion = | -2.503 |
|---|
Output 36.2.2: Preliminary Analysis of Data with Outliers: Plot Using and PROC SGSCATGTER
In the following SAS statements, a DATA step is used to remove low frequency clusters, then the FASTCLUS procedure is run again, selecting seeds from the high frequency clusters in the previous analysis using LEAST=1 clustering criterion. The results are shown in Output 36.2.3 and Output 36.2.4.
data seed;
   set mean1;
   if _freq_>5;
run;

title2 'PROC FASTCLUS Analysis Using LEAST= Clustering Criterion';
title3 'Values < 2 Reduce Effect of Outliers on Cluster Centers';
proc fastclus data=x seed=seed maxc=2 least=1 out=out;
   var x y;
run;

proc sgplot data=out;
   scatter y=y x=x / group=cluster;
run;
Output 36.2.3: Analysis of Data with Outliers Using the LEAST= Option
| Using PROC FASTCLUS to Analyze Data with Outliers |
| PROC FASTCLUS Analysis Using LEAST= Clustering Criterion |
| Values < 2 Reduce Effect of Outliers on Cluster Centers |
| Initial Seeds | ||
|---|---|---|
| Cluster | x | y |
| 1 | 2.794174248 | -0.065970836 |
| 2 | -2.027300384 | -2.051208579 |
| Minimum Distance Between Initial Seeds = | 6.806712 |
|---|
| Preliminary L(1) Scale Estimate = | 2.796579 |
|---|
| Number of Bins = | 100 |
|---|
| Iteration History | ||||
|---|---|---|---|---|
| Iteration | Criterion | Maximum Bin Size | Relative Change in Cluster Seeds |
|
| 1 | 2 | |||
| 1 | 1.3983 | 0.2263 | 0.4091 | 0.6696 |
| 2 | 1.0776 | 0.0226 | 0.00511 | 0.0452 |
| 3 | 1.0771 | 0.00226 | 0.00229 | 0.00234 |
| 4 | 1.0771 | 0.000396 | 0.000253 | 0.000144 |
| 5 | 1.0771 | 0.000396 | 0 | 0 |
| Convergence criterion is satisfied. |
| Criterion Based on Final Seeds = | 1.0771 |
|---|
| Cluster Summary | ||||||
|---|---|---|---|---|---|---|
| Cluster | Frequency | Mean Absolute Deviation |
Maximum Distance from Seed to Observation |
Radius Exceeded |
Nearest Cluster | Distance Between Cluster Medians |
| 1 | 102 | 1.1278 | 24.1622 | 2 | 4.2585 | |
| 2 | 108 | 1.0494 | 14.8292 | 1 | 4.2585 | |
| Cluster Medians | ||
|---|---|---|
| Cluster | x | y |
| 1 | 1.923023887 | 0.222482918 |
| 2 | -1.826721743 | -0.286253041 |
| Mean Absolute Deviations from Final Seeds |
||
|---|---|---|
| Cluster | x | y |
| 1 | 1.113465261 | 1.142120480 |
| 2 | 0.890331835 | 1.208370913 |
Output 36.2.4: Analysis Plot of Data with Outliers
The FASTCLUS procedure is run again, selecting seeds from high frequency clusters in the previous analysis. STRICT= prevents outliers from distorting the results. The results are shown in Output 36.2.5 and Output 36.2.6.
title2 'PROC FASTCLUS Analysis Using STRICT= to Omit Outliers';
proc fastclus data=x seed=seed
     maxc=2 strict=3.0 out=out outseed=mean2;
   var x y;
run;

proc sgplot data=out;
   scatter y=y  x=x / group=cluster;
run;
Output 36.2.5: Cluster Analysis with Outliers Omitted: PROC FASTCLUS SGPLOT
| Using PROC FASTCLUS to Analyze Data with Outliers |
| PROC FASTCLUS Analysis Using STRICT= to Omit Outliers |
| Initial Seeds | ||
|---|---|---|
| Cluster | x | y |
| 1 | 2.794174248 | -0.065970836 |
| 2 | -2.027300384 | -2.051208579 |
| Criterion Based on Final Seeds = | 0.9515 |
|---|
| Cluster Summary | ||||||
|---|---|---|---|---|---|---|
| Cluster | Frequency | RMS Std Deviation | Maximum Distance from Seed to Observation |
Radius Exceeded |
Nearest Cluster | Distance Between Cluster Centroids |
| 1 | 99 | 0.9501 | 2.9589 | 2 | 3.7666 | |
| 2 | 99 | 0.9290 | 2.8011 | 1 | 3.7666 | |
| Statistics for Variables | ||||
|---|---|---|---|---|
| Variable | Total STD | Within STD | R-Square | RSQ/(1-RSQ) |
| x | 2.06854 | 0.87098 | 0.823609 | 4.669219 |
| y | 1.02113 | 1.00352 | 0.039093 | 0.040683 |
| OVER-ALL | 1.63119 | 0.93959 | 0.669891 | 2.029303 |
| Pseudo F Statistic = | 397.74 |
|---|
| Approximate Expected Over-All R-Squared = | 0.60615 |
|---|
| Cubic Clustering Criterion = | 3.197 |
|---|
| Cluster Means | ||
|---|---|---|
| Cluster | x | y |
| 1 | 1.825111432 | 0.141211701 |
| 2 | -1.919910712 | -0.261558725 |
| Cluster Standard Deviations | ||
|---|---|---|
| Cluster | x | y |
| 1 | 0.889549271 | 1.006965219 |
| 2 | 0.852000588 | 1.000062579 |
Output 36.2.6: Cluster Analysis with Outliers Omitted: Plot Using PROC SGPLOT
Finally, the FASTCLUS procedure is run one more time with zero iterations to assign outliers and tails to clusters. The results are show in Output 36.2.7 and Output 36.2.8.
title2 'Final PROC FASTCLUS Analysis Assigning Outliers to Clusters';
proc fastclus data=x seed=mean2 maxc=2 maxiter=0 out=out;
   var x y;
run;

proc sgplot data=out;
   scatter y=y x=x / group=cluster;
run;
Output 36.2.7: Cluster Analysis with Outliers Omitted: PROC FASTCLUS
| Using PROC FASTCLUS to Analyze Data with Outliers |
| Final PROC FASTCLUS Analysis Assigning Outliers to Clusters |
| Initial Seeds | ||
|---|---|---|
| Cluster | x | y |
| 1 | 1.825111432 | 0.141211701 |
| 2 | -1.919910712 | -0.261558725 |
| Criterion Based on Final Seeds = | 2.0594 |
|---|
| Cluster Summary | ||||||
|---|---|---|---|---|---|---|
| Cluster | Frequency | RMS Std Deviation | Maximum Distance from Seed to Observation |
Radius Exceeded |
Nearest Cluster | Distance Between Cluster Centroids |
| 1 | 103 | 2.2569 | 17.9426 | 2 | 4.3753 | |
| 2 | 107 | 1.8371 | 11.7362 | 1 | 4.3753 | |
| Statistics for Variables | ||||
|---|---|---|---|---|
| Variable | Total STD | Within STD | R-Square | RSQ/(1-RSQ) |
| x | 2.92721 | 1.95529 | 0.555950 | 1.252000 |
| y | 2.15248 | 2.14754 | 0.009347 | 0.009435 |
| OVER-ALL | 2.56922 | 2.05367 | 0.364119 | 0.572621 |
| Pseudo F Statistic = | 119.11 |
|---|
| Approximate Expected Over-All R-Squared = | 0.49090 |
|---|
| Cubic Clustering Criterion = | -5.338 |
|---|
| Cluster Means | ||
|---|---|---|
| Cluster | x | y |
| 1 | 2.280017469 | 0.263940765 |
| 2 | -2.075547895 | -0.151348765 |
| Cluster Standard Deviations | ||
|---|---|---|
| Cluster | x | y |
| 1 | 2.412264861 | 2.089922815 |
| 2 | 1.379355878 | 2.201567557 |
Output 36.2.8: Cluster Analysis with Outliers Omitted: Plot Using PROC SGPLOT