The POWER Procedure
- Overview
-
Getting Started

-
Syntax
PROC POWER Statement LOGISTIC Statement MULTREG Statement ONECORR Statement ONESAMPLEFREQ Statement ONESAMPLEMEANS Statement ONEWAYANOVA Statement PAIREDFREQ Statement PAIREDMEANS Statement PLOT Statement TWOSAMPLEFREQ Statement TWOSAMPLEMEANS Statement TWOSAMPLESURVIVAL Statement TWOSAMPLEWILCOXON Statement
-
Details
Overview of Power Concepts Summary of Analyses Specifying Value Lists in Analysis Statements Sample Size Adjustment Options Error and Information Output Displayed Output ODS Table Names Computational Resources Computational Methods and Formulas ODS Graphics ODS Styles Suitable for Use with PROC POWER
-
Examples
One-Way ANOVA The Sawtooth Power Function in Proportion Analyses Simple AB/BA Crossover Designs Noninferiority Test with Lognormal Data Multiple Regression and Correlation Comparing Two Survival Curves Confidence Interval Precision Customizing Plots Binary Logistic Regression with Independent Predictors Wilcoxon-Mann-Whitney Test
- References
Choosing Key (Legend) Styles
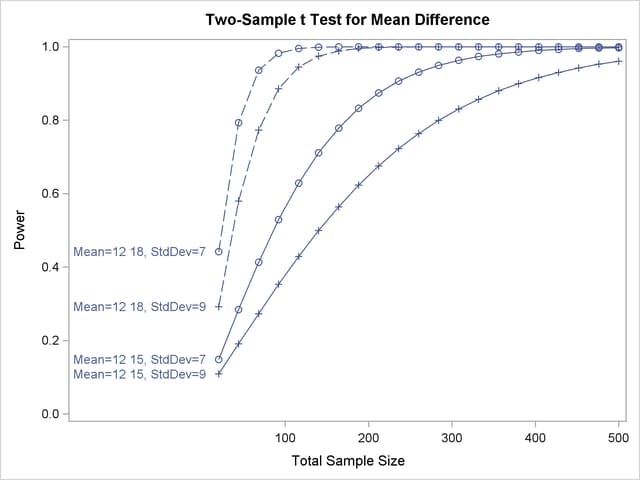
The default style for the key (or "legend") is one that displays the association between levels of features and levels of analysis parameters, located below the X axis. For example, Output 70.8.5 demonstrates this style of key.
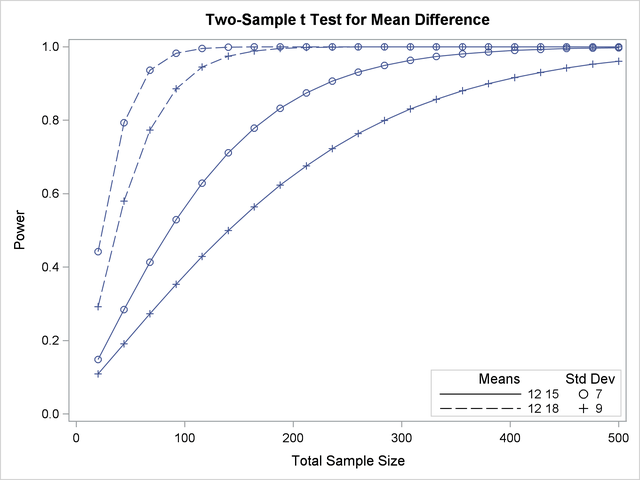
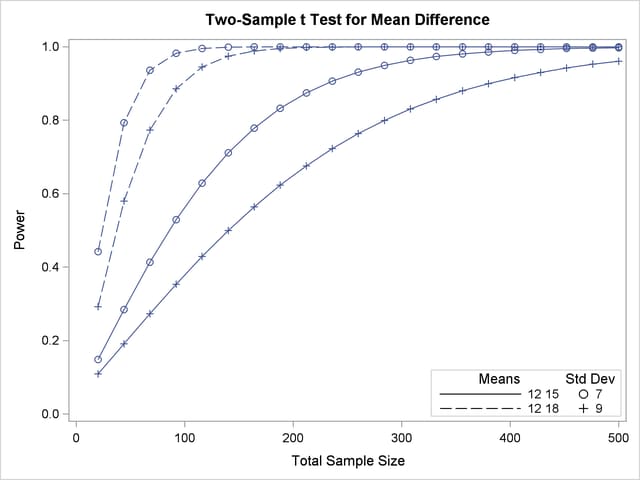
You can reproduce Output 70.8.5 with the same key but a different location, inside the plotting region, by using the POS=INSET option within the KEY=BYFEATURE option in the PLOT statement. The following statements product the plot in Output 70.8.17:
proc power plotonly;
   twosamplemeans test=diff
      groupmeans   = 12 | 15 18
      stddev       = 7 9
      power        = .
      ntotal       = 200;
   plot x=n min=20 max=500
      key = byfeature(pos=inset);
run;
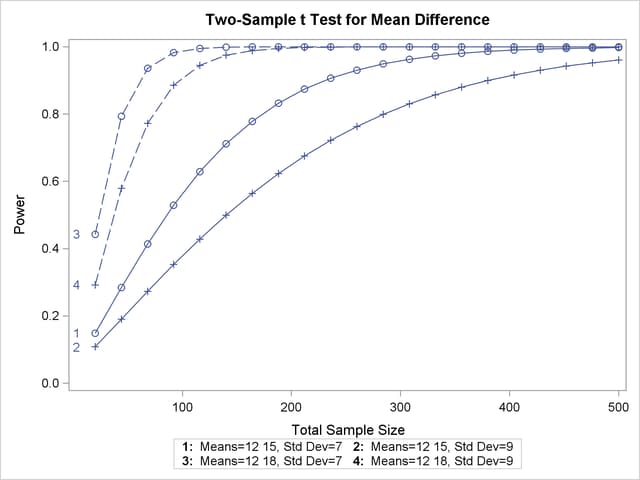
Alternatively, you can specify a key that identifies each individual curve separately by number by using the KEY=BYCURVE option in the PLOT statement:
   plot x=n min=20 max=500
      key = bycurve;
The resulting plot is shown in Output 70.8.18.
Use the NUMBERS=OFF option within the KEY=BYCURVE option to specify a nonnumbered key that identifies curves with samples of line styles, symbols, and colors:
   plot x=n min=20 max=500
      key = bycurve(numbers=off pos=inset);
The POS=INSET suboption places the key within the plotting region. The resulting plot is shown in Output 70.8.19.
Finally, you can attach labels directly to curves with the KEY=ONCURVES option. The following PLOT statement produces Output 70.8.20:
   plot x=n min=20 max=500
      key = oncurves;