| Statistical Graphics Using ODS |
| Principal Component Analysis Plots with PROC PRINCOMP |
This example is taken from Example 69.3 of Chapter 69, The PRINCOMP Procedure. The following statements create a SAS data set that contains ratings of job performance of police officers:
   options validvarname=any;

   data Jobratings;
      input ('Communication Skills'n
             'Problem Solving'n
             'Learning Ability'n
             'Judgment Under Pressure'n
             'Observational Skills'n
             'Willingness to Confront Problems'n
             'Interest in People'n
             'Interpersonal Sensitivity'n
             'Desire for Self-Improvement'n
             'Appearance'n
             'Dependability'n
             'Physical Ability'n
             'Integrity'n
             'Overall Rating'n) (1.);
      datalines;
   26838853879867

   ... more lines ...

   ;
The following statements set the output style to RTF and run PROC PRINCOMP:
   ods listing style=rtf;
   ods graphics on;

   proc princomp data=Jobratings(drop='Overall Rating'n) n=2
                 plots=(Matrix PatternProfile);
   run;
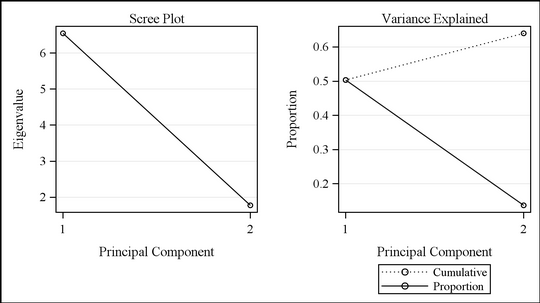
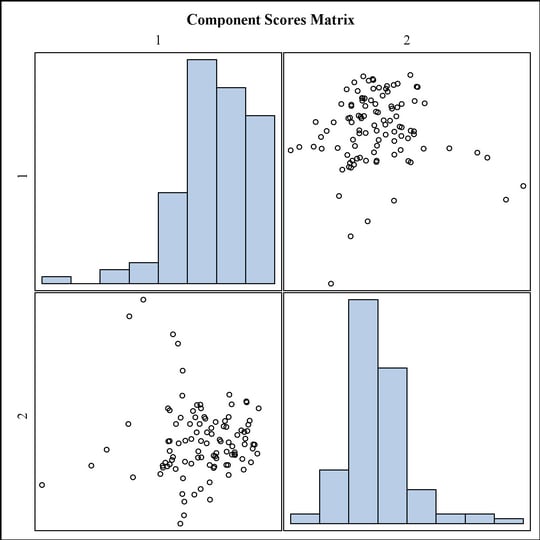
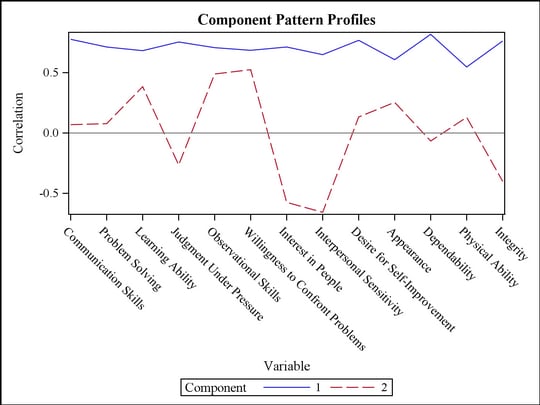
The plots are requested by the PLOTS=(MATRIX PATTERNPROFILE) option. The results, shown in Figure 21.11, contain the default scree and variance-explained plots, along with a scatter plot matrix of component scores and a pattern profile plot.
Figure 21.11
Principal Components Using the RTF Style
Copyright © 2009 by SAS Institute Inc., Cary, NC, USA. All rights reserved.