| Calculating Principal Components |
Principal Component Tables
The Eigenvalues (CORR) table illustrated in Figure 19.7 contains all the eigenvalues of the correlation matrix, differences between successive eigenvalues, the proportion of variance explained by each eigenvalue, and the cumulative proportion of the variance explained. Eigenvalues correspond to each of the principal components and represent a partitioning of the total variation in the sample. Because correlations are used, the sum of all the eigenvalues is equal to the number of variables. The first row of the table corresponds to the first principal component, the second row to the second principal component, and so on. In this example, the first two principal components account for over 97% of the variation.
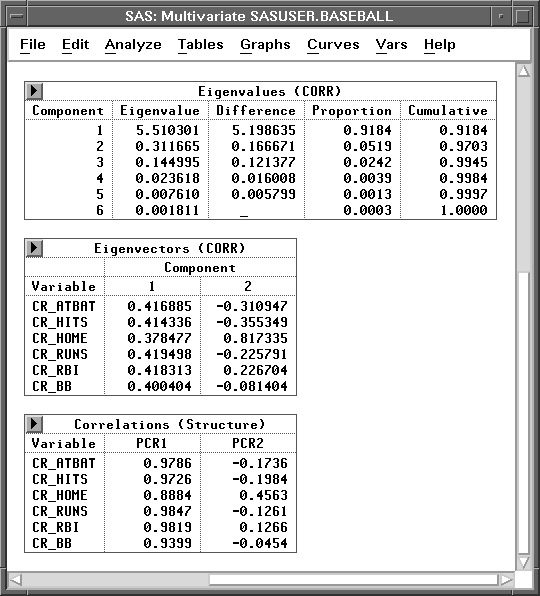
Figure 19.7: Principal Component Tables
The Eigenvectors (CORR) table illustrated in Figure 19.7 contains the first two eigenvectors of the correlation matrix. Eigenvectors correspond to each of the eigenvalues and associated principal components and are used to form linear combinations of the Y variables. The first column of the table corresponds to the first principal component, and the second column to the second principal component.
Now examine the coefficients making up the eigenvectors. The first component (PCR1) appears to be a measure of the player's overall performance as is evidenced by approximately the same magnitude of the coefficients corresponding to all six variables.
Next examine the coefficients making up the eigenvector for the second principal component (PCR2). Only the coefficients associated with the variables CR_HOME and CR_RBI are positive, and the remaining coefficients are negative. The coefficient with the variable CR_HOME is considerably larger than any of the other coefficients. This indicates a measure of career home runs performance versus other performance for 1986.
One way to quantify the strength of the linear relationship between the original Y variables and principal components is through the Correlations (Structure) table, as shown in Figure 19.7. This correlation matrix contains the correlations between the Y variables and the principal components.
Eigenvector coefficients of a relatively large magnitude translate into larger correlations and vice versa. For example, PCR2 has one coefficient substantially larger than other coefficients in the same eigenvector, CR_HOME. The correlation of the variable with this PCR2 is also large.
Copyright © 2007 by SAS Institute Inc., Cary, NC, USA. All rights reserved.