| Multivariate Analyses |
Maximum Redundancy Analysis
You can generate tables of output from maximum redundancy analysis by setting options in the Maximum Redundancy Options dialog shown in Figure 40.9 or from the Tables menu shown in Figure 40.11. Select Maximum Redundancy from the Tables menu to display the maximum redundancy dialog shown in Figure 40.27.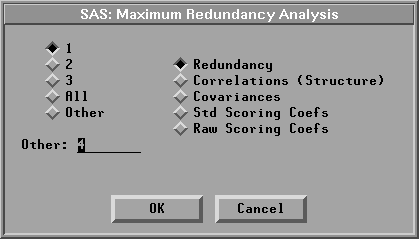
Figure 40.27: Maximum Redundancy Dialog
Either the raw (centered) or standardized variance is used in the maximum redundancy analysis, and it is specified in the Multivariate Method Options dialog in Figure 40.3. The Redundancy table includes the proportion and cumulative proportion of the variance of the set of Y variables and the set of X variables explained by the opposite canonical variables. Figure 40.28 shows tables of redundancy of the standardized Y and X variables.
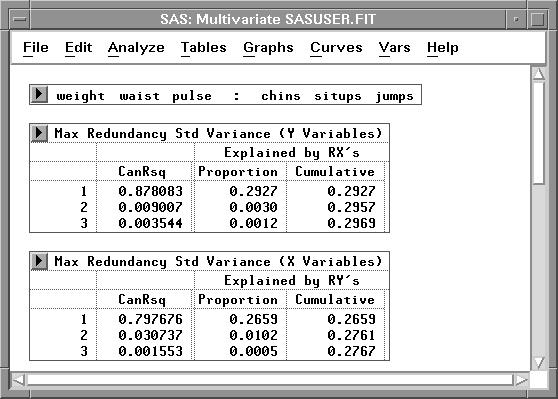
Figure 40.28: Maximum Redundancy Tables
The Correlations (Structure) or Covariances table includes the correlations or covariances between the Y, X variables and the maximum redundancy variables. Figure 40.29 shows the correlations and covariances between the Y, X variables and the first two maximum redundancy variables from the Y variables and the X variables.
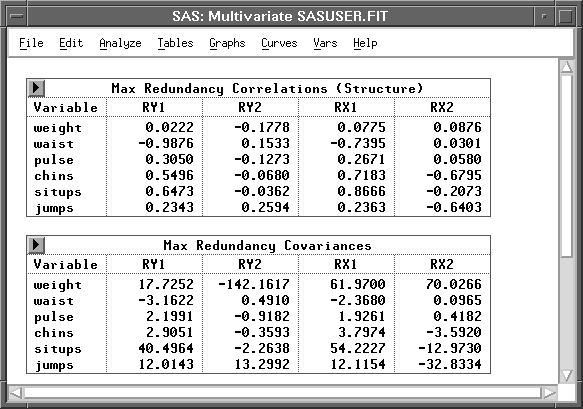
Figure 40.29: Correlation and Covariance Tables
The scoring coefficients are the coefficients of the Y or X variables that are used to compute maximum redundancy variables. The Std Scoring Coefs table includes the scoring coefficients of the standardized Y or X variables, and the Raw Scoring Coefs table includes the scoring coefficients of the centered Y or X variables. Figure 40.30 shows tables of the scoring coefficients of the standardized Y and X variables.
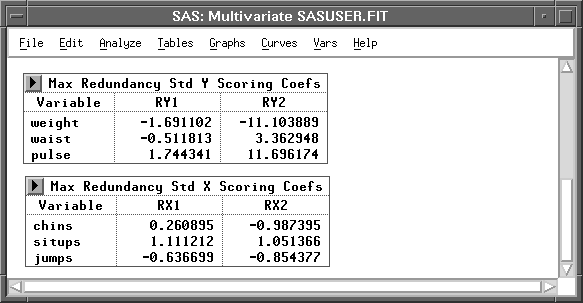
Figure 40.30: Standardized Scoring Coefficients Tables
Copyright © 2007 by SAS Institute Inc., Cary, NC, USA. All rights reserved.