| Multivariate Analyses |
Canonical Correlation Analysis
You can generate tables of output from canonical correlation analyses by setting options in the Canonical Correlation Options dialog shown in Figure 40.8 or from the Tables menu shown in Figure 40.11. Select Canonical Correlations from the Tables menu to display the canonical correlation dialog shown in Figure 40.23.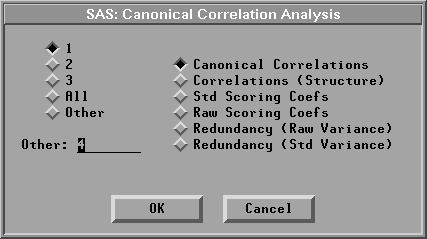
Figure 40.23: Canonical Correlation Dialog
The Canonical Correlations table contains the following:
- CanCorr, the canonical correlations, which are always nonnegative
- Adj. CanCorr, the adjusted canonical correlations, which are asymptotically less biased than the raw correlations and may be negative. The adjusted canonical correlations may not be computable, and they are displayed as missing values if two canonical correlations are nearly equal or if some are close to zero. A missing value is also displayed if an adjusted canonical correlation is larger than a previous adjusted canonical correlation.
- Approx Std. Error, the approximate standard errors of the canonical correlations
- CanRsq, the squared canonical correlations
- Eigenvalues, the eigenvalues of the matrix R-1yy Ryx R-1xx Ryx'. These eigenvalues are equal to CanRsq/(1-CanRsq), where CanRsq is the corresponding squared canonical correlation. Also printed for each eigenvalue is the difference from the next eigenvalue, the proportion of the sum of the eigenvalues, and the cumulative proportion.
- Test for H0: CanCorrj=0, j>=k, the likelihood ratio for the hypothesis that the current canonical correlation and all smaller ones are zero in the population
- Approx F based on Rao's approximation to the distribution of the likelihood ratio
- Num DF and Den DF (numerator and denominator degrees of freedom) and
Pr > F (probability level) associated with the F statistic
Figure 40.24 shows tables of canonical correlations.
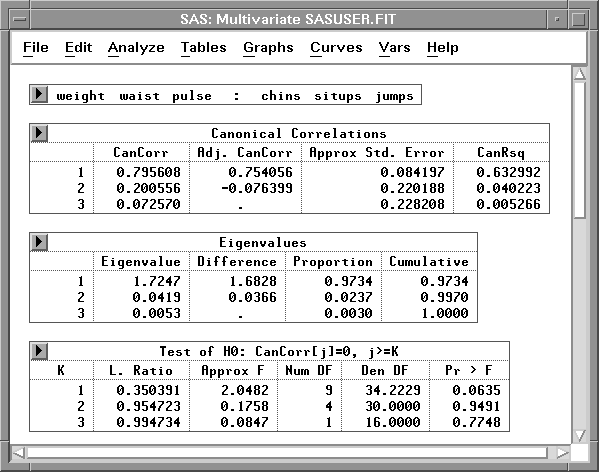
Figure 40.24: Canonical Correlations Tables
The Correlations (Structure) table includes the correlations between the input Y, X variables and canonical variables.
The scoring coefficients are the coefficients of the Y or X variables that are used to compute canonical variable scores. The Std Scoring Coefs table includes the scoring coefficients of the standardized Y or X variables and the Raw Scoring Coefs table includes the scoring coefficients of the centered Y or X variables.
Figure 40.25 shows a table of correlations between the Y, X variables and the first two canonical variables from the Y and X variables and the tables of scoring coefficients of the standardized Y and X variables.
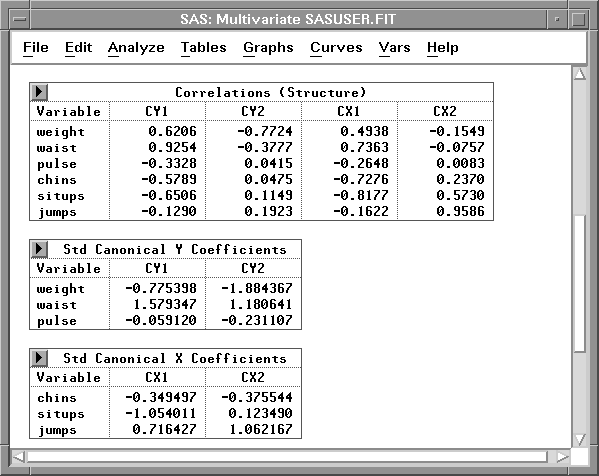
Figure 40.25: Correlations and Scoring Coefficients Tables
The Redundancy table gives the canonical redundancy analysis, which includes the proportion and cumulative proportion of the raw (unstandardized) and the standardized variance of the set of Y and the set of X variables explained by their own canonical variables and explained by the opposite canonical variables. Figure 40.26 shows tables of redundancy of standardized Y and X variables.
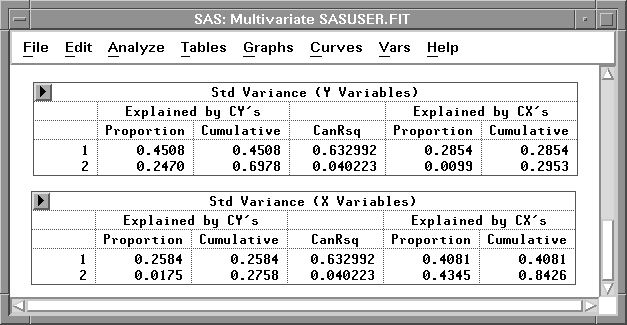
Figure 40.26: Redundancy Tables
Copyright © 2007 by SAS Institute Inc., Cary, NC, USA. All rights reserved.