| Analyzing by Groups |
Comparing Groups by Copying Windows
Because there are six groups, it is difficult to compare two groups side by side. Also, the axes are scaled to fit the data, so by default graphs use different axes.
To compare two groups side by side using the same axes, you can create a copy of the distribution analysis, set tick marks, and align the axes.
| Choose Edit:Windows:Copy Window in the Distribution analysis. |
This creates a copy of the distribution analysis.
| Move the two analyses side by side. |
Now you can scroll the windows horizontally to compare any two groups. Figure 22.4 shows the first and last groups side by side.
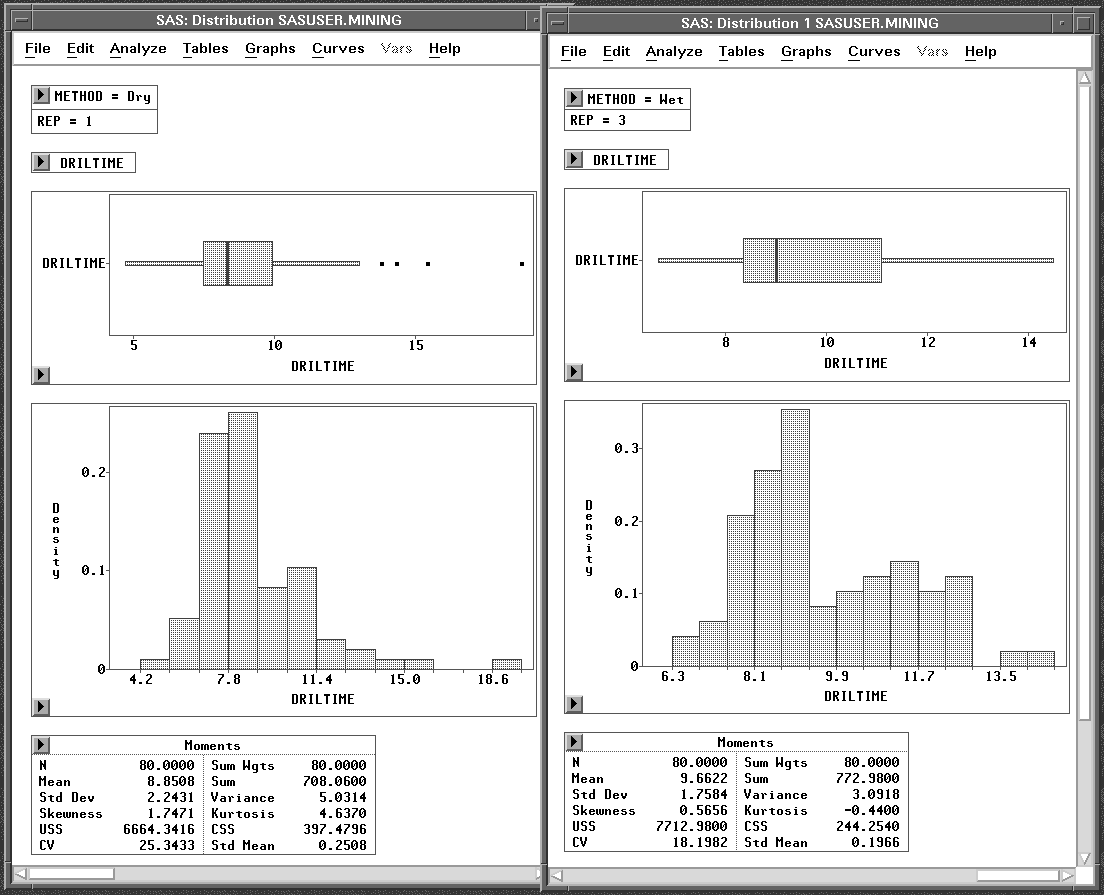
Figure 22.4: Comparing Distribution Analyses
The Moments and Quantiles tables below the histograms present statistics you can compare. The box plots and histograms, however, are difficult to compare because they use different axes. You can customize the axes with the following steps.
| Select DRILTIME in the first distribution window. |
| Choose Ticks from the histogram pop-up menu in the first window. |
This displays the Ticks dialog.
| Make the adjustments shown in the following figure, and click the OK button. |
This scales the DRILTIME axis for all histograms.
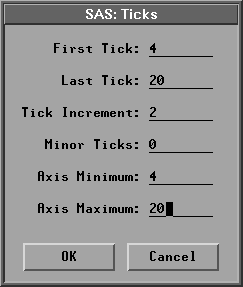
Figure 22.5: Ticks Dialog
| Repeat these steps for the box plots in the first window. |
This scales the DRILTIME axis for all box plots.
| Repeat these steps for the second window. |
Now you can compare box plots and histograms in both windows.
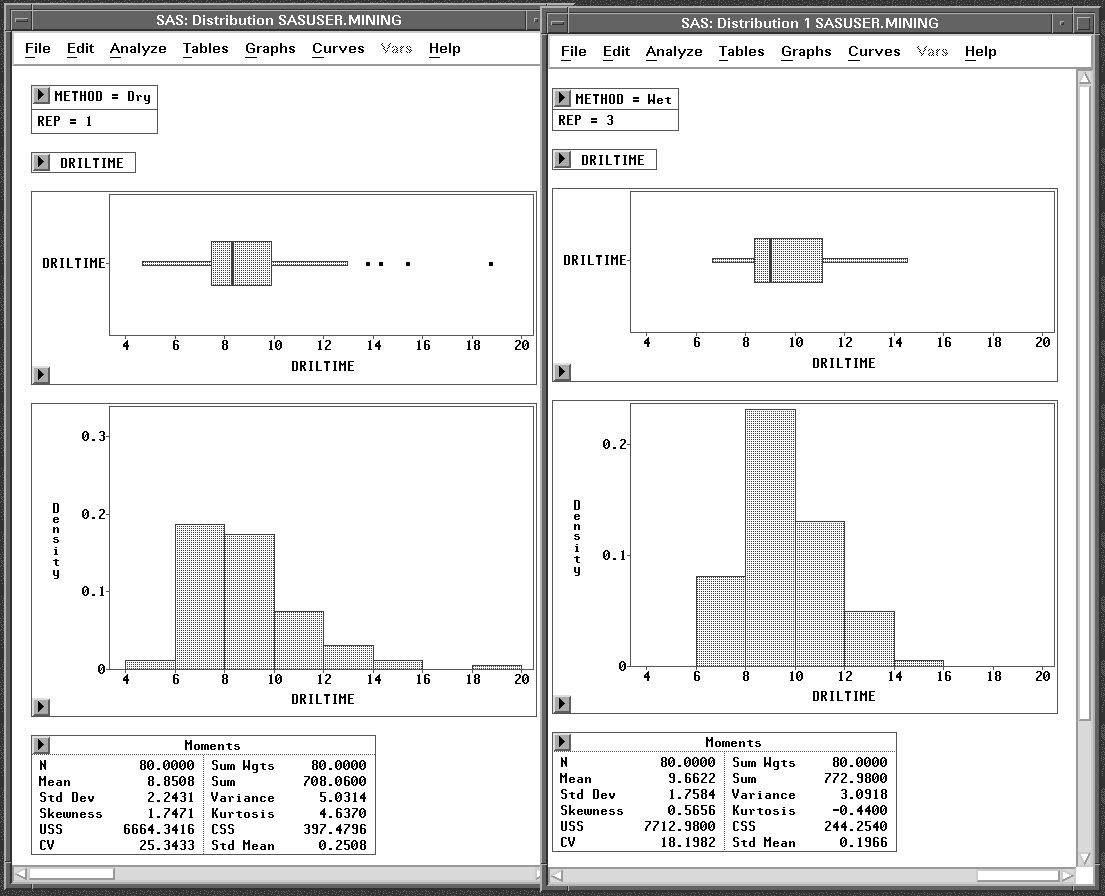
Figure 22.6: Comparing Distribution Analyses
Note |
By default, axes in SAS/INSIGHT software are scaled to fit the data. You can choose Edit:Windows:Align in any analysis window to align axes that use the same variable. Aligning affects only the axis scale, not the tick marks. When aligning histogram axes as in the preceding example, you should use the Ticks dialog to give histogram bars the same width and position. |
Related Reading |
Distributions, Chapter 38. |
Copyright © 2007 by SAS Institute Inc., Cary, NC, USA. All rights reserved.