| Analyzing by Groups |
Using Group Variables
You can learn more about the distribution of drilling times by constructing a distribution analysis using group variables.
| Choose Analyze:Distribution (Y). |
This displays the distribution variables dialog.
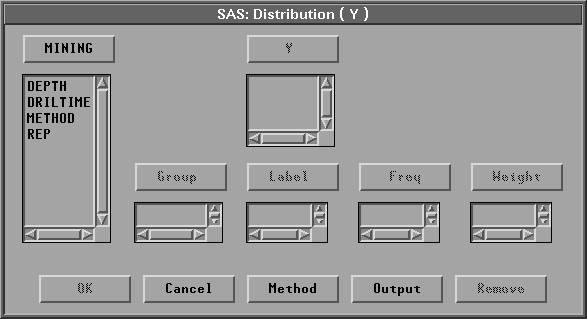
Figure 22.2: Distribution Variables Dialog
| In the dialog, select DRILTIME, then click the Y button. |
This assigns DRILTIME the required Y role.
| Select METHOD and REP, and click the Group button. |
This assigns METHOD and REP the Group role. You can scroll the Group list to see both variables. Because there are two values for Method and three values for Rep, this produces six groups.
| Click OK to create the distribution window, as shown in Figure 22.3. |
The distribution window shows detailed information on the distributions, including box plots, histograms, moments, and quantiles. At the top of the distribution window is a table indicating the unique combination of values of the two group variables. You can scroll the distribution window to the right to see other levels.
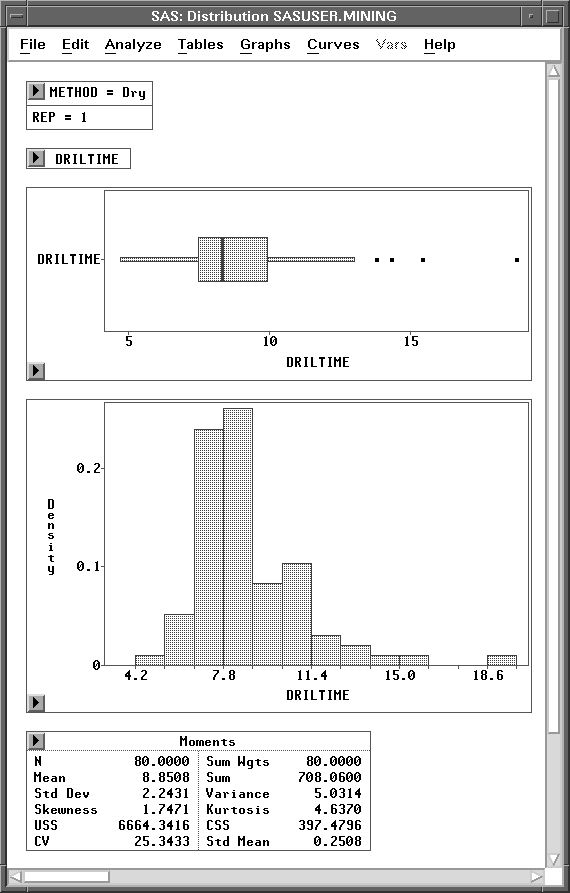
Figure 22.3: Distribution Window with Group Variables
Copyright © 2007 by SAS Institute Inc., Cary, NC, USA. All rights reserved.