| Fit Analyses |
Type III Tests
Type III tests examine the significance of each partial effect, that is, the significance of an effect with all the other effects in the model. They are computed by constructing a type III hypothesis matrix L and then computing statistics associated with the hypothesis L![]() = 0. Refer to the chapter titled "The Four Types of Estimable Functions," in the SAS/STAT User's Guide for the construction of the matrix L.
= 0. Refer to the chapter titled "The Four Types of Estimable Functions," in the SAS/STAT User's Guide for the construction of the matrix L.
For linear models, the type III or partial sum of squares
- (Lb)' (L (X'X)-1 L')-1 (Lb)
The Type III Tests table for linear models, as illustrated by Figure 39.15, includes the following:
- Source
- is the name for each effect.
- DF
- is the degrees of freedom associated with each effect.
- Sum of Squares
- is the partial sum of squares for each effect in the model.
- Mean Square
- is the sum of squares divided by its associated degrees of freedom.
- F Stat
- is the F statistic for testing the null hypothesis that the linear combinations of parameters described previously for the hypothesis matrix L are 0. This is formed by dividing the mean square for the hypothesis matrix L by the mean square for error from the complete model.
- Pr > F
- is the probability of obtaining a greater F statistic than that observed if the null hypothesis is true.
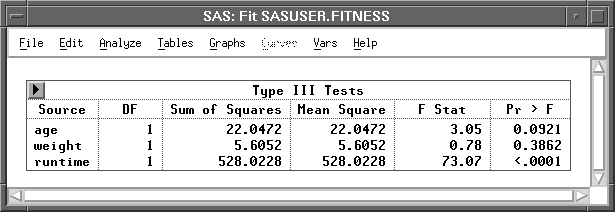
Figure 39.15: Type III Tests Table for Linear Models
For generalized linear models, either the Wald statistic or the likelihood-ratio statistic can be used to test the hypothesis L
The Wald statistic is given by
The Type III (Wald) Tests and Type III (LR) Tests tables, as illustrated by Figure 39.16, include the following:
- Source
- is the name for each effect.
- DF
- is the degrees of freedom associated with each effect.
- ChiSq
- is the Wald statistic for the Wald tests or the likelihood-ratio statistic for the LR tests of the null hypothesis that the parameters for the effect are 0. This has an asymptotic
 distribution.
- Pr > ChiSq
- is the probability of obtaining a greater statistic than that observed, if the null hypothesis is true.
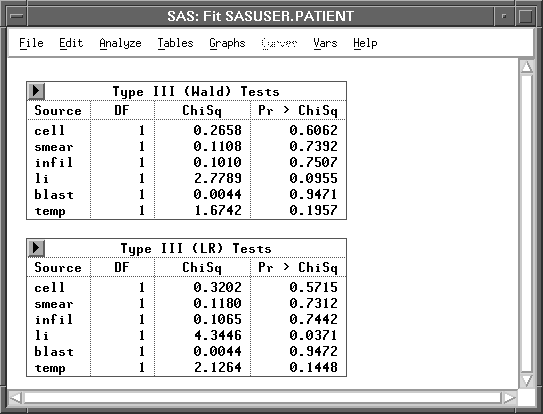
Figure 39.16: Type III Tests Tables for Generalized Linear Models
Copyright © 2007 by SAS Institute Inc., Cary, NC, USA. All rights reserved.