| Fit Analyses |
Type I Tests
Type I tests examine the sequential incremental improvement in the fit of the model as each effect is added. They can be computed by fitting the model in steps and recording the difference in error sum of squares (linear models) and log-likelihood statistics (generalized linear models). The Type I Tests table for linear models, as illustrated by Figure 39.13, includes the following:
- Source
- is the name for each effect.
- DF
- is the degrees of freedom associated with each effect.
- Sum of Squares
- is the incremental error sum of squares for the model as each effect is added.
- Mean Square
- is the sum of squares divided by its associated degrees of freedom.
- F Stat
- is the F statistic for testing the null hypothesis that the parameters for the added effect are 0. This is formed by dividing the mean square for the effect by the mean square for error from the complete model.
- Pr > F
- is the probability of obtaining a greater F statistic than that observed if the null hypothesis is true.
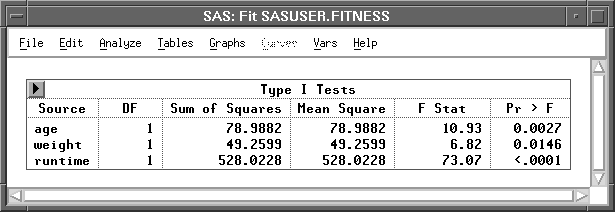
Figure 39.13: Type I Tests Table
The Type I (LR) Tests table for generalized linear models, as illustrated by Figure 39.14, includes the following:
- Source
- is the name for each effect.
- DF
- is the degrees of freedom associated with each effect.
- ChiSq
- is the
 value for testing the null hypothesis that the parameters for the added effect are 0. This is evaluated as twice the incremental log-likelihood for the model as each effect is added, and it has an asymptotic distribution under the null hypothesis.
- Pr > ChiSq
- is the probability of obtaining a greater statistic than that observed, if the null hypothesis is true.
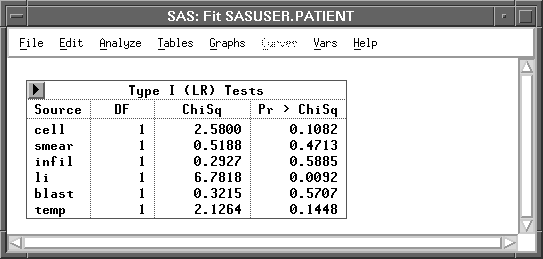
Figure 39.14: Type I Likelihood Ratio Tests
Copyright © 2007 by SAS Institute Inc., Cary, NC, USA. All rights reserved.