| Distribution Analyses |
Basic Confidence Intervals
Assuming that the population is normally distributed, the Confidence Intervals table gives confidence intervals for the mean, standard deviation, and variance at the confidence coefficient specified. You specify the confidence intervals either in the distribution output options dialog or from the Tables menu.
![[menu]](images/dist_diseq64.gif)
Figure 38.10: Basic Confidence Intervals Menu
The ![]() confidence interval for the mean has upper and lower limits
confidence interval for the mean has upper and lower limits
For weighted analyses, the limits are
For large values of n, ![]() acts as
acts as ![]() ,the
,the ![]() critical value of the standard normal distribution.
critical value of the standard normal distribution.
The ![]() confidence interval for the standard deviation has upper and lower limits
confidence interval for the standard deviation has upper and lower limits
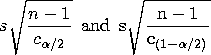
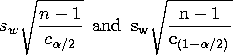
For weighted analyses, the limits are
The ![]() confidence interval for the variance has upper and lower limits equal to the squares of the corresponding upper and lower limits for the standard deviation.
confidence interval for the variance has upper and lower limits equal to the squares of the corresponding upper and lower limits for the standard deviation.
Figure 38.11 shows a table of the 95% confidence intervals for the mean, standard deviation, and variance.
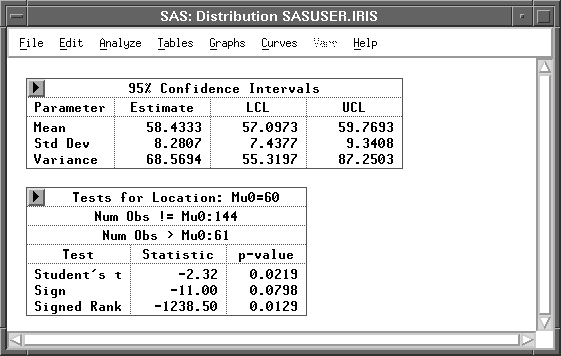
Figure 38.11: Basic Confidence Intervals and Tests for Location Tables
Note |
The confidence intervals are set to missing if vardef |
Copyright © 2007 by SAS Institute Inc., Cary, NC, USA. All rights reserved.