| Distribution Analyses |
Quantiles
It is often convenient to subdivide the area under a density curve so that the area to the left of the dividing value is some specified fraction of the total unit area. For a given value of p between 0 and 1, the pth quantile (or 100 pth percentile) is the value such that the area to the left of it is p.
The pth quantile is computed from the empirical distribution function with averaging:
where i is the integer part and f is the fractional part of np=i+f.
If you specify a Weight variable, the pth quantile is computed as
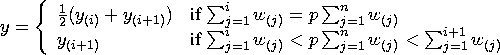
When each observation has an identical weight, the weighted quantiles are identical to the unweighted quantiles.
The Quantiles table, as shown in Figure 38.9, includes the following statistics:
- 100% Max is the maximum, y(n).
- 75% Q3 is the upper quartile (the 75th percentile).
- 50% Med is the median.
- 25% Q1 is the lower quartile (the 25th percentile).
- 0% Min is the minimum, y(1).
- 99%, 97.5%, 95%, 90%, 10%, 5%, 2.5%, and 1% give the corresponding percentiles.
- Range is the range, y(n) - y(1).
- Q3-Q1, the interquartile range, is the difference between the upper and lower quartiles.
- Mode is the most frequently occurring value. When there is more than one mode, the lowest mode is displayed. When all the distinct values have frequency one, the value is set to missing.
Copyright © 2007 by SAS Institute Inc., Cary, NC, USA. All rights reserved.