| Distribution Analyses |
Tests for Location
The location tests include the Student's t, sign, and signed rank tests of the hypothesis that the mean/median is equal to a given value ![]() against the two-sided alternative that the mean/median is not equal to
against the two-sided alternative that the mean/median is not equal to ![]() .The Student's t test is appropriate when the data are from an approximately normal population; otherwise, nonparametric tests such as the sign or signed rank test should be used.
.The Student's t test is appropriate when the data are from an approximately normal population; otherwise, nonparametric tests such as the sign or signed rank test should be used.
The Student's t gives a Student's t statistic
For weighted analyses, the t statistic is computed as
Assuming that the null hypothesis (H0: mean = ![]() ) is true and the population is normally distributed, the t statistic has a Student's t distribution with n-1 degrees of freedom. The p-value is the probability of obtaining a Student's t statistic greater in absolute value than the absolute value of the observed statistic t.
) is true and the population is normally distributed, the t statistic has a Student's t distribution with n-1 degrees of freedom. The p-value is the probability of obtaining a Student's t statistic greater in absolute value than the absolute value of the observed statistic t.
Note |
The t statistic and p-value are set to missing if vardef |
The Sign statistic is
- M = (1/2) ( n+ - n-)
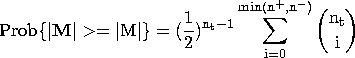
Assuming that the null hypothesis (H0: median = ![]() ) is true, the p-value for the observed statistic M is
) is true, the p-value for the observed statistic M is
The Signed Rank test assumes that the distribution is symmetric. The signed rank statistic is computed as ![]() where r+i is the rank of
where r+i is the rank of ![]() after discarding yi values equal to
after discarding yi values equal to ![]() , and the sum is calculated for values of
, and the sum is calculated for values of ![]() .Average ranks are used for tied values.
.Average ranks are used for tied values.
The p-value is the probability of obtaining a signed rank statistic greater in absolute value than the absolute value of the observed statistic S. If nt <= 20, the p-value of the statistic S is computed from the exact distribution of S. When nt > 20, the significance level of S is computed by treating
as a Student's t variate with nt-1 degrees of freedom, where V is computed as
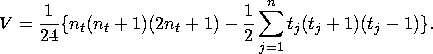
The sum is calculated over groups tied in absolute value, and tj is the number of tied values in the jth group (Iman 1974, Lehmann 1975).
You can specify location tests either in the distribution output options dialog or in the Location Tests dialog after choosing Tables:Tests for Location from the menu.
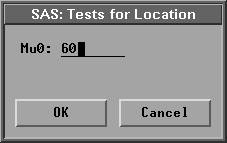
Figure 38.12: Location Tests Dialog
In the dialog, you can specify the parameter ![]() .Figure 38.11 shows a table of the three location tests for
.Figure 38.11 shows a table of the three location tests for ![]() = 60. Here, Num Obs != Mu0 is the number of observations with values not equal to
= 60. Here, Num Obs != Mu0 is the number of observations with values not equal to ![]() , and Num Obs > Mu0 is the number of observations with values greater than
, and Num Obs > Mu0 is the number of observations with values greater than ![]() .
.
For weighted analyses, the sign and signed rank tests are not generated.
Copyright © 2007 by SAS Institute Inc., Cary, NC, USA. All rights reserved.