| Box Plots and Mosaic Plots |
Method
Observations with missing values for Y variables are not used. Observations with Freq values that are missing or that are less than or equal to 0 are not used. Only the integer part of Freq values is used.
The following method is used to compute the median and quartiles. Let
n be the number of data values
y1, y2, ... , yn be the data values listed in increasing order
p be the desired percentile (25, 50, or 75)
i be the integer part, and f the fractional part, of the ordinal of the desired percentile:
i + f = n * p / 100
Then the value of the desired percentile is
You can adjust three calculation methods by clicking on the Method button in the variables dialog. This displays the method options dialog.
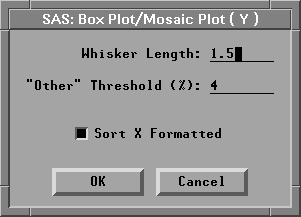
Figure 33.5: Box Plot/Mosaic Plot Method Options Dialog
By default, whiskers on the box plot are drawn from the quartiles to the farthest observation not farther than 1.5 times the distance between the quartiles. Type your preferred whisker length factor in the entry field. The figures in this chapter were created using whisker lengths that were 1.0 times the distance between the quartiles; this results in more observations being classified as outliers.
By default, for variables in mosaic plots, values that represent less than 4% of the total frequency are grouped together in an "Other" category. The Method dialog enables you to change the threshold at which values are grouped in the Other category.
By default, X variable values are sorted by their formatted value. Turn off the Sort X Formatted check box to sort X variable values by their unformatted value.
Copyright © 2007 by SAS Institute Inc., Cary, NC, USA. All rights reserved.