| Box Plots and Mosaic Plots |
Variables
To create a box plot or mosaic plot, choose Analyze:Box Plot/Mosaic Plot ( Y ). If you have previously selected one or more variables, they are assigned the required Y variable role. A single plot is created containing a separate schematic diagram for each Y variable selected. For interval Y variables, box plots are created. For nominal Y variables, mosaic plots are created.
If you have not selected any variables, a variables dialog appears.
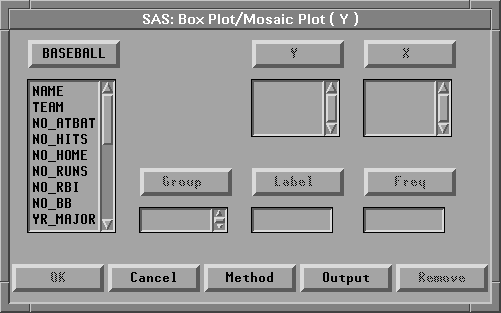
Figure 33.2: Box Plot/Mosaic Plot Variables Dialog
In the dialog, select at least one Y variable.
You can select one or more X variables to compare distributions. If you do not select X variables, you get one plot containing one schematic diagram for each Y variable. If you select X variables, you get one plot for each Y variable, and each plot contains one schematic diagram for each combination of X values. For example, Figure 33.3 shows the box plot created using the BASEBALL data set with NO_HITS as the Y variable and LEAGUE as the X variable.
You can select one or more Group variables if you have grouped data. This creates a separate box or mosaic plot for each group. For example, Figure 33.4 shows the box plots created using the BASEBALL data set with NO_HITS as the Y variable and LEAGUE as the Group variable.
You can select a Label variable to label extreme values in box plots.
If you select a Freq variable, each observation is assumed to represent n observations, where n is the value of the Freq variable.
You can identify extreme values in the box plot and display the mean or average value. You can also control the marker size of extreme values and the information shown in the box plot axes.
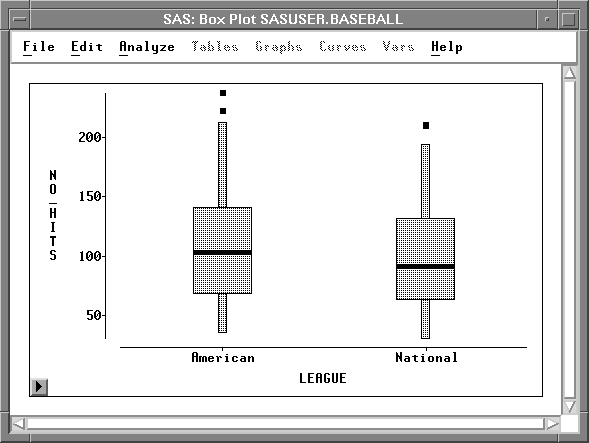
Figure 33.3: Box Plot Using X Variable
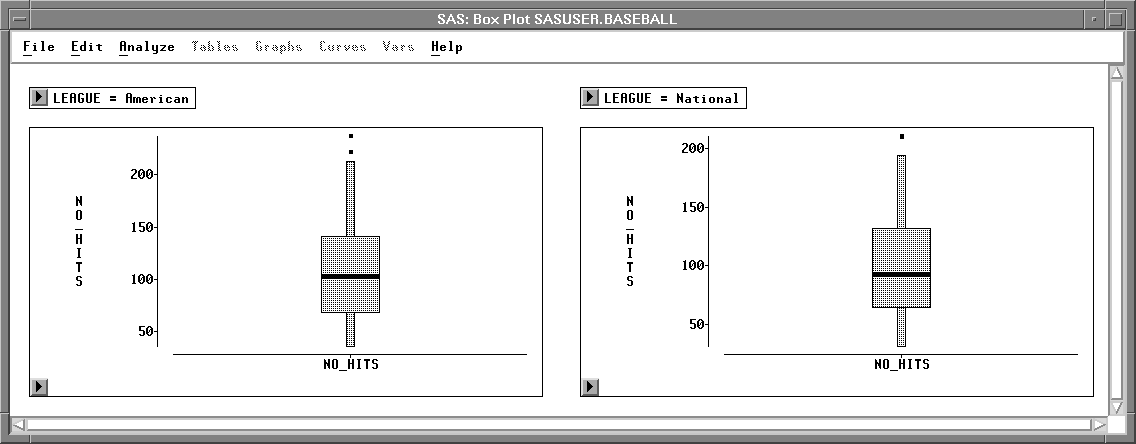
Figure 33.4: Box Plot Using Group Variable
Copyright © 2007 by SAS Institute Inc., Cary, NC, USA. All rights reserved.