PCHART Statement: SHEWHART Procedure

Example 18.23 Specifying Standard Average Proportion
Note: See p Charts-Specifying Std Average Proportion in the SAS/QC Sample Library.
In some situations, a standard (known) value ( ) is available for the expected proportion of nonconforming items, based on extensive testing or previous sampling. This example
illustrates how you can specify to create a p chart.
) is available for the expected proportion of nonconforming items, based on extensive testing or previous sampling. This example
illustrates how you can specify to create a p chart.
A p chart is used to monitor the proportion of failing circuits in the data set Circuits, which is introduced in Creating p Charts from Count Data. The expected proportion is known to be  . The following statements create a p chart, shown in Output 18.23.1, using to compute the control limits:
ods graphics off;
title1 'p Chart for Failing Circuits';
title2 'Using Data in CIRCUITS and Standard Value P0=0.02';
proc shewhart data=Circuits;
   pchart Fail*Batch / subgroupn = 500
                       p0        = 0.02
                       psymbol   = p0
                       wneedles  = 3
                       nolegend;
   label Batch = 'Batch Number'
         Fail  = 'Fraction Failing';
run;
Output 18.23.1: A p Chart with Standard Value 
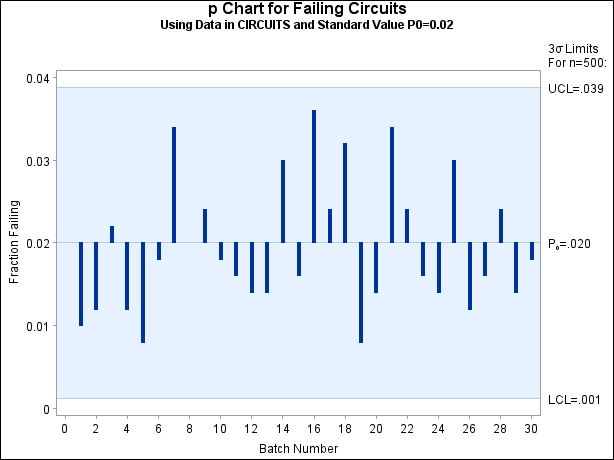
The chart indicates that the process is in control. The P0=
option specifies . The PSYMBOL=
option specifies a label for the central line indicating that the line represents a standard value. The NEEDLES
option connects points to the central line with vertical needles. The NOLEGEND
option suppresses the default legend for subgroup sample sizes. Labels for the vertical and horizontal axes are provided
with the LABEL statement. For details concerning axis labeling, see Axis Labels.
Alternatively, you can specify using the variable _P_ in a LIMITS= data set, as follows:
data Climits;
   length _var_ _subgrp_ _type_ $8;
   _p_      = 0.02;
   _subgrp_ = 'Batch';
   _var_    = 'Fail';
   _type_   = 'STANDARD';
   _limitn_ = 500;
run;
proc shewhart data=Circuits limits=Climits;
   pchart Fail*Batch / subgroupn = 500
                       psymbol   = p0
                       nolegend
                       needles;
   label batch ='Batch Number'
         fail  ='Fraction Failing';
run;
The bookkeeping variable _TYPE_ indicates that _P_ has a standard value. The chart produced by these statements is identical to the chart in Output 18.23.1.