The RAREEVENTS Procedure(Experimental)

Example 16.1 Monitoring Urinary Tract Infections
The data for this example are from Santiago and Smith (2013).
A hospital system tracked the frequency of urinary tract infections (UTIs) acquired by patients while in one of its hospitals.
The following statements create a SAS data set with the variable DaysBetween, which contains the number of days between discharges from the hospital of male patients who acquired UTIs while there:
data UrinaryTractInfections;
   input DaysBetween @@;
   label DaysBetween = 'Days between UTIs';
datalines;
0.57014 0.07431 0.15278 0.14583 0.13889
0.14931 0.03333 0.08681 0.33681 0.03819
0.24653 0.29514 0.11944 0.05208 0.12500
0.25000 0.40069 0.02500 0.12014 0.11458
0.00347 0.12014 0.04861 0.02778 0.32639
0.64931 0.14931 0.01389 0.03819 0.46806
0.22222 0.29514 0.53472 0.15139 0.52569
0.07986 0.27083 0.04514 0.13542 0.08681
0.40347 0.12639 0.18403 0.70833 0.15625
0.24653 0.04514 0.01736 1.08889 0.05208
0.02778 0.03472 0.23611 0.35972
;
The following statements produce a graph that compares the data to a theoretical distribution whose parameters are estimated from the data. The RAREEVENTS procedure uses an exponential distribution by default because the data are continuous.
proc rareevents data=UrinaryTractInfections;
   compare DaysBetween / nbins=12;
run;
The NBINS= option specifies that 12 histogram bins be used to display the data. Output 16.1.1 shows the resulting histogram of the data overlaid with the exponential curve.
Output 16.1.1: Distribution of Intervals between UTIs
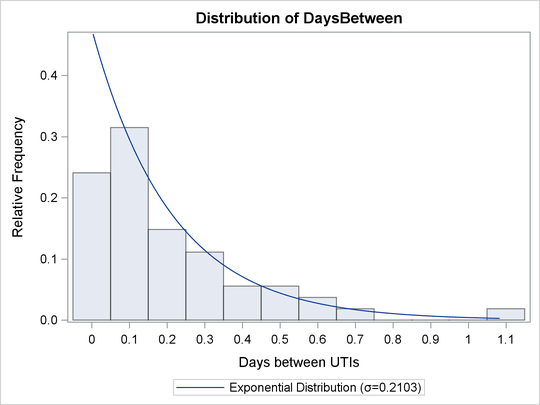
The histogram indicates that an exponential distribution is appropriate for the data. The following statements produce a rare events chart for the days between UTIs:
proc rareevents data=UrinaryTractInfections;
   chart DaysBetween / totpanels=1;
run;
The TOTPANELS=
option specifies that all the observations be displayed in a single panel, or page. No index variable is specified, so the
DaysBetween values are numbered consecutively, starting with 1. Output 16.1.2 shows the resulting chart.
Output 16.1.2: Rare Events Chart for Urinary Tract Infections
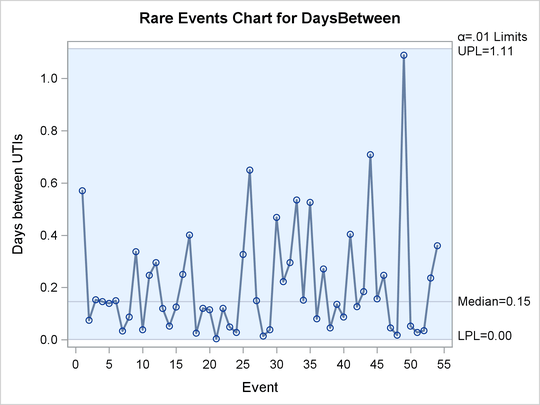
The rare events chart shows no indication of unusual variation in the incidence of UTIs among male patients.
Although Santiago and Smith (2013) provide the data as the (continuous) numbers of days between patient discharges, they could just as well have been recorded
as the (integer) number of minutes between discharges. The following statements compute the variable MinutesBetween, which contains counts of the minutes between infections, and produce a rare events chart of the counts. Because the data
are integer values, the probability limits are based on a geometric distribution.
data UrinaryTractInfections;
   set UrinaryTractInfections;
   MinutesBetween = round( DaysBetween * 1440, 1 );
run;
proc rareevents data=UrinaryTractInfections;
   chart MinutesBetween / totpanels=1;
run;
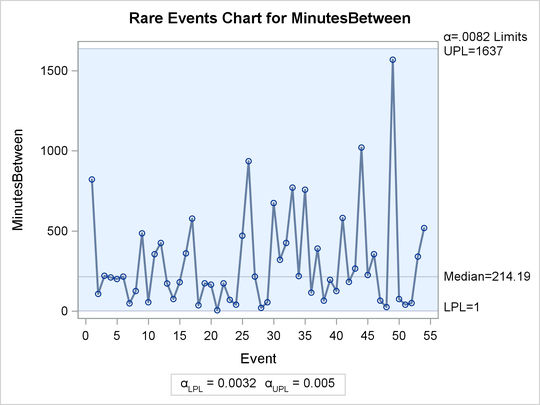
Output 16.1.3 shows the rare events chart for MinutesBetween. The median and probability limits for this chart are very close, but not exactly equal, to the corresponding values measured
in days in Output 16.1.2.
Output 16.1.3: Rare Events Chart for Urinary Tract Infections