The RAREEVENTS Procedure(Experimental)

Constructing Rare Events Charts
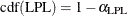
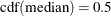
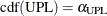
Each point on the rare events chart indicates the value of an individual measurement from the input data set. You compute the lower probability limit (LPL), median, and upper probability limit (UPL) by solving for their values in the following equations, which use the cumulative distribution function (CDF) of the probability distribution that you specify in the DIST= option:
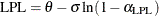
Probability Limits Based on an Exponential Distribution
The cumulative distribution function of an exponential distribution with scale parameter  and threshold parameter
  is
is
![\[ \mr{cdf}(x) = 1 - \exp \left(-\frac{(x-\theta )}{\sigma }\right) \]](images/qcug_rareevents0022.png)
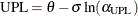
Solving the equations listed previously, the median and probability limits values are as follows:

Probability Limits Based on a Geometric Distribution
The cumulative distribution function of a geometric distribution with shift parameter a and probability p is
![\[ \mr{cdf}(x) = 1 - (1 - p)^{x - a + 1} \]](images/qcug_rareevents0026.png)
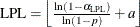
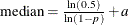
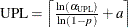
Because the geometric distribution is used with integer data, meaningful probability limits must have integer values. Therefore the solutions to the equations listed previously are
The probability of a value from the distribution being greater than the UPL is as close as possible to  without exceeding it, and the probability of a value from the distribution being less than the LPL is as close as possible
to
without exceeding it, and the probability of a value from the distribution being less than the LPL is as close as possible
to  without exceeding it. The and values that correspond to the computed limits are displayed in a legend on the rare events chart.
With integer probability limits, it is not unusual for the computed LPL to be equal to the minimum possible data value, so that no data value can be less than the LPL. In that case, the following value is computed:
![\[ m = \left\lceil \frac{\ln (\alpha _{\mr{LPL}})}{\ln (p)} \right\rceil \]](images/qcug_rareevents0030.png)
The probability of a sequence of m consecutive values from the geometric distribution each being equal to the LPL is as close to as possible without exceeding it. The RAREEVENTS procedure flags any sequence of m consecutive measurements equal to the LPL as a sign of unusual variation.