The MVPMODEL Procedure

Example 12.2 Computing the Classical  Statistic
Note: The CV= option is experimental in this release.
This example uses the MVPMODEL procedure to produce a classical statistic and then compares it to the statistic produced by the principal component model with the NCOMP=ALL option. The two statistics are discussed in the section
Details: MVPMODEL Procedure, and this example demonstrates that when the data set is centered and scaled correctly, the statistics are equal. The classical
statistic is computed using the common quadratic form, which is implemented in SAS/IML. This example highlights the standardization
that occurs by default in the MVPMODEL procedure. The example uses more of the airline delay data set that is first described
in the section Getting Started: MVPMODEL Procedure. This data set covers the New England region of the continental United States. As before, the variables are airlines and
the observations are mean daily delays during February 2007. The following statements create a SAS data set that contains
these airline flight delays:
data flightDelaysNE;
   input  AA CO DL F9 FL NW UA US WN;
   datalines;
15.7  7.1  8.6  6.3 14.6  6.2  7.0 11.0  6.4
16.0 19.4 10.7  6.4 19.0  6.1  8.3 14.4 14.2
14.5  1.5  5.4 13.3 13.6  9.7 16.6  7.5  9.9
12.4 14.3  5.8  0.7 11.8 20.1 11.2  8.6  8.1
19.8 27.6  7.3 16.1 13.3 14.8 39.9 16.4  9.7
20.5 12.2  0.2 -4.8  3.7 14.2 41.7  4.9  9.2
 8.3  4.1  3.4  4.2 -2.3  6.3 24.9  8.7  4.4
 4.7 14.1  1.8 18.1 -1.9 10.2  5.4  5.8  3.7
16.7 15.0  3.5 11.8  0.8  7.3 11.1  7.2  5.1
 6.2  0.6  2.6  9.3  3.0  4.0  4.0  6.9  1.9
 6.9  8.4  0.3  1.7 -1.1 10.4  8.7  9.4  4.6
16.5  7.7  2.5  8.1  4.2 11.0 18.4  6.2  2.4
21.2 10.2  5.6  1.1 18.7  9.2 35.0 49.7 35.9
22.5 30.0 26.1 14.2 41.5 46.2 43.6 75.5 34.1
62.7 60.4 39.5 27.6 44.9 27.9 51.5 64.7 38.2
31.3 41.4 23.1 40.2 19.3 19.7 28.3 40.4 17.3
The following statements use the MVPMODEL procedure to create classical statistics:
proc mvpmodel data=flightDelaysNE ncomp=all plots=none out=mvpout;
   var AA CO DL F9 FL NW UA US WN;
run;
Specifying NCOMP=
ALL sets the number of principal components to be used in the model equal to the number of process variables. Therefore, as
discussed in the section Details: MVPMODEL Procedure, the mvpout data set contains the classical statistic for each observation, 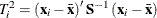 .
.
The following SAS/IML statements generate the Hotelling statistic for the data set by using the traditional quadratic form. However, the data must first be standardized as done
by the MVPMODEL procedure.
Note: If you do not want PROC MVPMODEL to center or scale the data, specify the NOCENTER or NOSCALE option, respectively.
proc iml;
   use flightDelaysNE;
   read all into x;
   n = nrow(x);
   p = ncol(x);
   xc = x-x[:,]; /* Create a centered data set*/
   ss = xc[##,];  /* Compute sum of squares */
   std=sqrt(ss/(n-1));  /* Compute standard deviations */
   std_x = xc/std;  /* Create a standardized data set*/
   S= cov(std_x);  /* Compute covariance of standardized data*/
   tsq = J(n,1,.);
   do i = 1 to n;
   /* Compute the classical T2 statistic using quadratic form */
      tsq[i] = std_x[i,]*inv(S)*std_x[i,]`;
   end;
   varnames = "tsq";
   create classicTsq from tsq [colname = varnames];
   append from tsq;
quit;
To compare the output from the MVPMODEL procedure with the output from SAS/IML, a new data set, mvpTsq, which contains the statistics computed by using the quadratic form in SAS/IML, is created:
data mvpTsq;
   set mvpOut(rename=(_TSQUARE_=tsq));
   keep tsq;
run;
Finally, you can verify that the two statistics are equivalent within machine precision by using the COMPARE procedure:
proc compare base=classicTsq compare=mvpTsq
             method=relative briefsummary;
run;
Output 12.2.1: Comparison of Statistics