PCHART Statement: SHEWHART Procedure

Note: See p Charts-Tests for Special Causes in the SAS/QC Sample Library.
This example shows how you can apply tests for special causes to make p charts more sensitive to special causes of variation. The following statements create a SAS data set named Circuit3, which contains the number of failing circuits for 20 batches from the circuit manufacturing process introduced in Creating p Charts from Count Data:
data Circuit3;
   input Batch Fail @@;
   datalines;
 1 12    2 21    3 16    4  9
 5  3    6  4    7  6    8  9
 9 11   10 13   11 12   12  7
13  2   14 14   15  9   16  8
17 14   18 10   19 11   20  9
;
The following statements create the p chart, apply several tests to the chart, and tabulate the results:
ods graphics off;
title1'p Chart for the Proportion of Failing Circuits';
title2 'Tests = 1 to 4';
proc shewhart data=Circuit3;
   pchart Fail*Batch / subgroupn = 500
                       tests     = 1 to 4
                       zones
                       zonelabels
                       ltests    = 20
                       table
                       tabletest
                       tablelegend;
run;
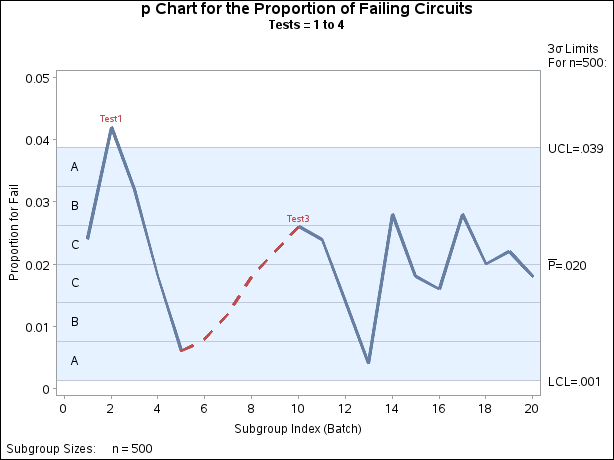
The chart is shown in Output 17.22.1, and the printed output is shown in Output 17.22.2. The TESTS= option requests Tests 1, 2, 3, and 4, which are described in Tests for Special Causes: SHEWHART Procedure. The TABLETESTS option requests a table of proportions of nonconforming items and control limits, with a column indicating which subgroups tested positive for special causes. The TABLELEGEND option adds a legend describing the tests that are positive.
The ZONELABELS option displays zone lines and zone labels on the chart. The zones are used to define the tests. The LTESTS= option specifies the line type used to connect the points in a pattern for a test that is signaled.
Output 17.22.1 and Output 17.22.2 indicate that Test 1 is positive at batch 2 and Test 3 is positive at batch 10.
Output 17.22.2: Tabular Form of p Chart
| p Chart for the Proportion of Failing Circuits |
| Tests = 1 to 4 |
| p Chart Summary for Fail | |||||
|---|---|---|---|---|---|
| Batch | Subgroup Sample Size |
3 Sigma Limits with n=500 for Proportion | Special Tests Signaled |
||
| Lower Limit |
Subgroup Proportion |
Upper Limit |
|||
| 1 | 500 | 0.00121703 | 0.02400000 | 0.03878297 | |
| 2 | 500 | 0.00121703 | 0.04200000 | 0.03878297 | 1 |
| 3 | 500 | 0.00121703 | 0.03200000 | 0.03878297 | |
| 4 | 500 | 0.00121703 | 0.01800000 | 0.03878297 | |
| 5 | 500 | 0.00121703 | 0.00600000 | 0.03878297 | |
| 6 | 500 | 0.00121703 | 0.00800000 | 0.03878297 | |
| 7 | 500 | 0.00121703 | 0.01200000 | 0.03878297 | |
| 8 | 500 | 0.00121703 | 0.01800000 | 0.03878297 | |
| 9 | 500 | 0.00121703 | 0.02200000 | 0.03878297 | |
| 10 | 500 | 0.00121703 | 0.02600000 | 0.03878297 | 3 |
| 11 | 500 | 0.00121703 | 0.02400000 | 0.03878297 | |
| 12 | 500 | 0.00121703 | 0.01400000 | 0.03878297 | |
| 13 | 500 | 0.00121703 | 0.00400000 | 0.03878297 | |
| 14 | 500 | 0.00121703 | 0.02800000 | 0.03878297 | |
| 15 | 500 | 0.00121703 | 0.01800000 | 0.03878297 | |
| 16 | 500 | 0.00121703 | 0.01600000 | 0.03878297 | |
| 17 | 500 | 0.00121703 | 0.02800000 | 0.03878297 | |
| 18 | 500 | 0.00121703 | 0.02000000 | 0.03878297 | |
| 19 | 500 | 0.00121703 | 0.02200000 | 0.03878297 | |
| 20 | 500 | 0.00121703 | 0.01800000 | 0.03878297 | |