PCHART Statement: SHEWHART Procedure

Note: See p Chart Examples in the SAS/QC Sample Library.
The previous example illustrates how you can create p charts using raw data (counts of nonconforming items). However, in many applications, the data are provided in summarized form as proportions or percentages of nonconforming items. This example illustrates how you can use the PCHART statement with data of this type.
The following data set provides the data from the preceding example in summarized form:
data Cirprop;
   input Batch pFailed @@;
   Sampsize=500;
   datalines;
 1  0.010   2  0.012   3  0.022   4  0.012   5  0.008
 6  0.018   7  0.034   8  0.020   9  0.024  10  0.018
11  0.016  12  0.014  13  0.014  14  0.030  15  0.016
16  0.036  17  0.024  18  0.032  19  0.008  20  0.014
21  0.034  22  0.024  23  0.016  24  0.014  25  0.030
26  0.012  27  0.016  28  0.024  29  0.014  30  0.018
;
A partial listing of Cirprop is shown in Figure 17.63. The subgroups are still indexed by Batch. The variable pFailed contains the proportions of nonconforming items, and the variable Sampsize contains the subgroup sample sizes.
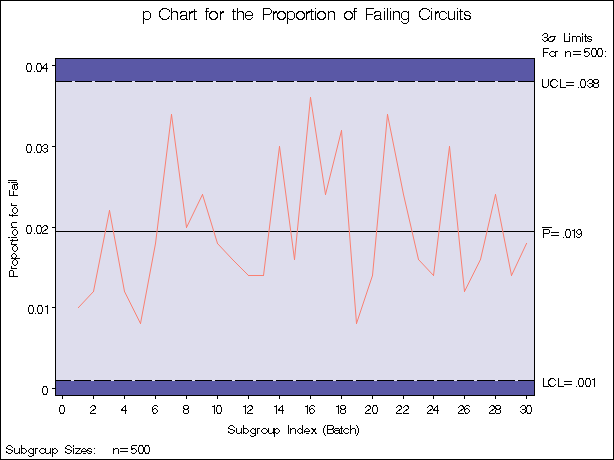
The following statements create a p chart identical to the one in Figure 17.61:
title 'p Chart for the Proportion of Failing Circuits';
proc shewhart data=Cirprop;
   pchart pFailed*Batch / subgroupn=Sampsize
                          dataunit =proportion;
label pfailed = 'Proportion for Fail';
run;
The DATAUNIT= option specifies that the values of the process (pFailed) are proportions of nonconforming items. By default, the values of the process are assumed to be counts of nonconforming items (see the previous example).
Alternatively, you can read the data set Cirprop by specifying it as a HISTORY= data set in the PROC SHEWHART statement. A HISTORY= data set used with the PCHART statement must contain the following variables:
-
subgroup variable
-
subgroup proportion of nonconforming items variable
-
subgroup sample size variable
Furthermore, the names of the subgroup proportion and sample size variables must begin with the process name specified in the PCHART statement and end with the special suffix characters P and N, respectively.
To specify Cirprop as a HISTORY= data set and Fail as the process, you must rename the variables pFailed and Sampsize to FailP and FailN, respectively. The following statements temporarily rename pFailed and Sampsize for the duration of the procedure step:
options nogstyle;
goptions ftext=swiss;
title 'p Chart for the Proportion of Failing Circuits';
proc shewhart history=Cirprop(rename=(pFailed=FailP
                              Sampsize=FailN ));
   pchart Fail*Batch / cframe    = lib
                       cinfill   = bwh
                       coutfill  = yellow
                       cconnect  = salmon;
run;
options gstyle;
The NOGSTYLE system option causes ODS styles not to affect traditional graphics. Instead, the PCHART statement options control the appearance of the graph. The GSTYLE system option restores the use of ODS styles for traditional graphics produced subsequently. The resulting p chart is shown in Figure 17.64.
In this example, it is more convenient to use Cirprop as a DATA= data set than as a HISTORY= data set. In general, it is more convenient to use the HISTORY= option for input data
sets that have been previously created by the SHEWHART procedure as OUTHISTORY= data sets, as illustrated in the next example.
For more information, see HISTORY= Data Set.