PCHART Statement: SHEWHART Procedure

Note: See p Chart Examples in the SAS/QC Sample Library.
In the previous example, the OUTLIMITS= data set Cirlim saved control limits computed from the data in Circuits. This example shows how these limits can be applied to new data provided in the following data set:
data Circuit2;
   input Batch Fail @@;
   datalines;
31  12   32   9   33  16   34   9
35   3   36   8   37  20   38   4
39   8   40   6   41  12   42  16
43   9   44   2   45  10   46   8
47  14   48  10   49  11   50   9
;
The following statements create a p chart for the data in Circuit2 using the control limits in Cirlim:
ods graphics on;
title 'p Chart for the Proportion of Failing Circuits';
proc shewhart data=Circuit2 limits=Cirlim;
   pchart Fail*Batch / subgroupn = 500
                       odstitle  = title;
run;
The ODS GRAPHICS ON statement specified before the PROC SHEWHART statement enables ODS Graphics, so the p chart is created by using ODS Graphics instead of traditional graphics.
The LIMITS= option in the PROC SHEWHART statement specifies the data set containing the control limits. By default, this information is read from the first observation in the LIMITS= data set for which
-
the value of
_VAR_matches the process nameFail -
the value of
_SUBGRP_matches the subgroup-variable nameBatch
The resulting p chart is shown in Figure 17.68.
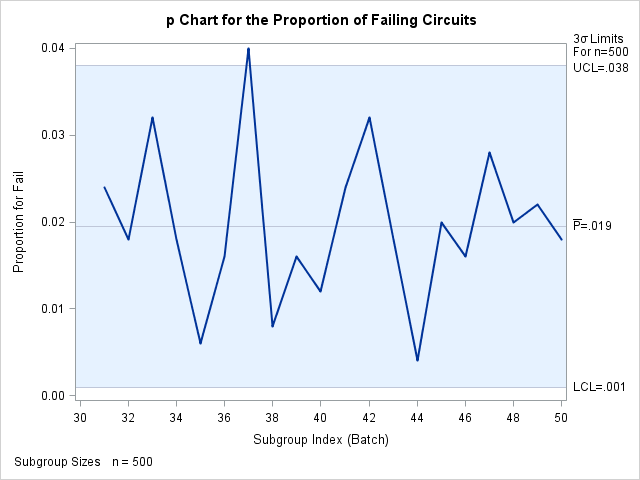
The proportion of nonconforming items in the 37th batch exceeds the upper control limit, signaling that the process is out of control.
In this example, the LIMITS= data set was created in a previous run of the SHEWHART procedure. You can also create a LIMITS= data set with the DATA step. See LIMITS= Data Set for details concerning the variables that you must provide.