CDFPLOT Statement: CAPABILITY Procedure

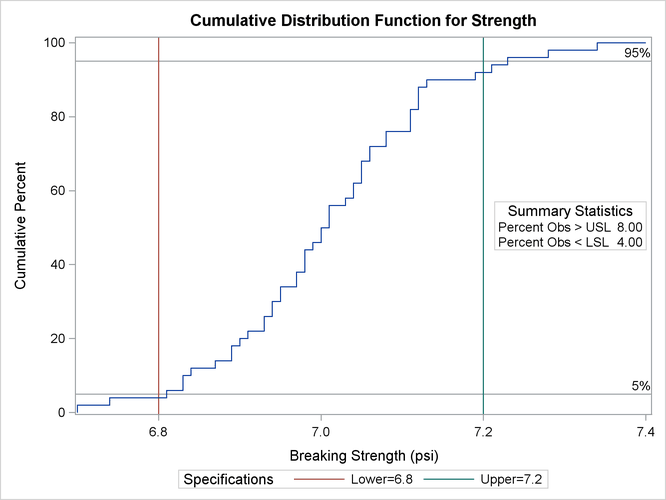
See CAPCDF1 in the SAS/QC Sample LibraryCustomer requirements dictate that the breaking strengths in the previous example have upper and lower specification limits of 7.2 and 6.8 psi, respectively. Moreover, less than 5% of the cords can have breaking strengths outside the limits.
The following statements create a cdf plot with reference lines at the 5% and 95% cumulative percent levels:
ods graphics on;
proc capability data=Cord noprint;
   spec lsl=6.8 usl=7.2;
   cdf Strength / vref         = 5 95
                  vreflabels   = '5%' '95%' ;
   inset pctgtr pctlss / format = 5.2
                         pos    = e
                         header = "Summary Statistics";
run;
The ODS GRAPHICS ON statement specified before the PROC CAPABILITY statement enables ODS Graphics, so the cdf plot is created by using ODS Graphics instead of traditional graphics.
The INSET statement requests an inset with the percentages of measurements above the upper limit and below the lower limit. For more information about the INSET statement, see INSET Statement: CAPABILITY Procedure.
In Output 5.5.1, the empirical cdf is below the intersection between the lower specification limit line and the 5% line, so less than 5% of the measurements are below the lower limit. The ecdf, however, is also below the intersection between the upper specification limit line and the 95% line, implying that more than 5% of the measurements are greater than the upper limit. Thus, the goal of having less than 5% of the measurements above the upper specification limit has not been met.