CDFPLOT Statement: CAPABILITY Procedure

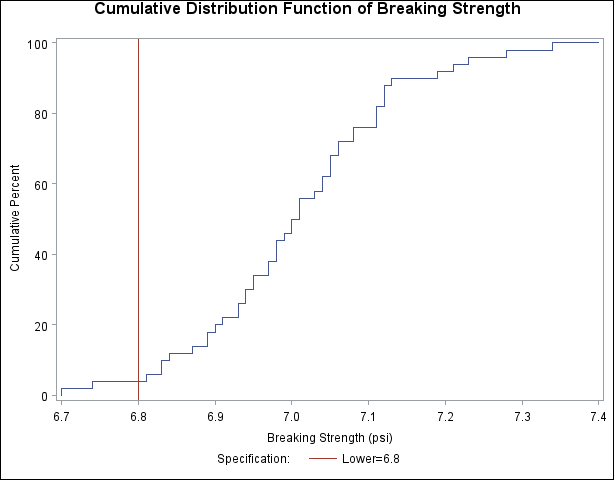
See CAPCDF1 in the SAS/QC Sample LibraryThis section introduces the CDFPLOT statement with a simple example. A company that produces fiber optic cord is interested
in the breaking strength of the cord. The following statements create a data set named Cord, which contains 50 breaking strengths measured in pounds per square inch (psi), and they display the cdf plot in Figure 5.5. The plot shows a symmetric distribution with observations concentrated 6.9 and 7.1. The plot also shows that only a small
percentage (< 5%) of the observations are below the lower specification limit of 6.8.
data Cord;
   label Strength="Breaking Strength (psi)";
   input Strength @@;
   datalines;
6.94 6.97 7.11 6.95 7.12 6.70 7.13 7.34 6.90 6.83
7.06 6.89 7.28 6.93 7.05 7.00 7.04 7.21 7.08 7.01
7.05 7.11 7.03 6.98 7.04 7.08 6.87 6.81 7.11 6.74
6.95 7.05 6.98 6.94 7.06 7.12 7.19 7.12 7.01 6.84
6.91 6.89 7.23 6.98 6.93 6.83 6.99 7.00 6.97 7.01
;
ods graphics off;
title 'Cumulative Distribution Function of Breaking Strength';
proc capability data=Cord noprint;
   spec lsl=6.8;
   cdf Strength;
run;