XCHART Statement: SHEWHART Procedure

Example 17.34 Applying Tests for Special Causes
See SHWTEST in the SAS/QC Sample LibraryThis example illustrates how you can apply tests for special causes to make ![]() charts more sensitive to special causes of variation.
charts more sensitive to special causes of variation.
The following statements create an ![]() chart for the gap width measurements in the data set
chart for the gap width measurements in the data set Parts in Creating Charts for Means from Subgroup Summary Data and tabulate the results:
ods graphics on;
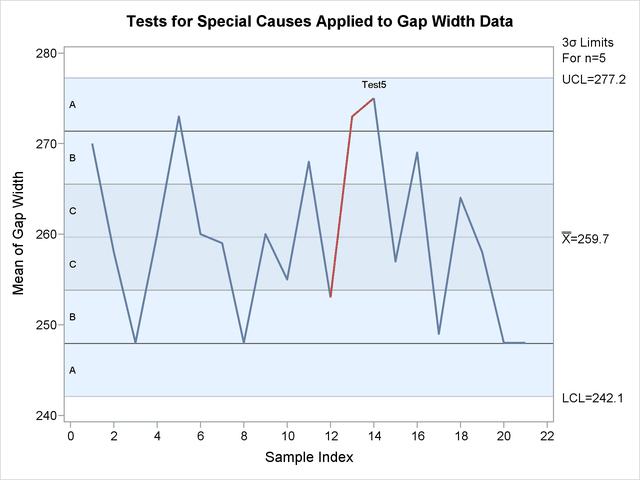
title 'Tests for Special Causes Applied to Gap Width Data';
proc shewhart history=Parts;
xchart Partgap*Sample/ tests = 1 to 5
odstitle = title
tabletests
nolegend
tablecentral
tablelegend
zonelabels;
run;
The ![]() chart is shown in Output 17.34.1 and the printed output is shown in Output 17.34.2. The TESTS= requests Tests 1, 2, 3, 4, and 5, which are described in Tests for Special Causes: SHEWHART Procedure. The TABLECENTRAL option requests a table of the subgroup means, control limits, and central line. The TABLETESTS option
adds a column indicating which subgroups tested positive for special causes, and the TABLELEGEND option adds a legend describing
the tests that were signaled.
chart is shown in Output 17.34.1 and the printed output is shown in Output 17.34.2. The TESTS= requests Tests 1, 2, 3, 4, and 5, which are described in Tests for Special Causes: SHEWHART Procedure. The TABLECENTRAL option requests a table of the subgroup means, control limits, and central line. The TABLETESTS option
adds a column indicating which subgroups tested positive for special causes, and the TABLELEGEND option adds a legend describing
the tests that were signaled.
The ZONELABELS option displays zone lines and zone labels on the chart. The zones are used to define the tests. The NOLEGEND option suppresses the subgroup sample size legend that is displayed by default in the lower left corner of the chart.
Output 17.34.1 and Output 17.34.2 indicate that Test 5 was positive at sample 14, signaling a possible shift in the mean of the process.
Output 17.34.1: Tests for Special Causes Displayed on an ![]() Chart
Chart
Output 17.34.2: Tabular Form of ![]() Chart
Chart
| Tests for Special Causes Applied to Gap Width Data |
| Means Chart Summary for Partgap | ||||||
|---|---|---|---|---|---|---|
| Sample | Subgroup Sample Size |
3 Sigma Limits with n=5 for Mean | Special Tests Signaled |
|||
| Lower Limit |
Subgroup Mean |
Average Mean |
Upper Limit |
|||
| 1 | 5 | 242.08741 | 270.00000 | 259.66667 | 277.24592 | |
| 2 | 5 | 242.08741 | 258.00000 | 259.66667 | 277.24592 | |
| 3 | 5 | 242.08741 | 248.00000 | 259.66667 | 277.24592 | |
| 4 | 5 | 242.08741 | 260.00000 | 259.66667 | 277.24592 | |
| 5 | 5 | 242.08741 | 273.00000 | 259.66667 | 277.24592 | |
| 6 | 5 | 242.08741 | 260.00000 | 259.66667 | 277.24592 | |
| 7 | 5 | 242.08741 | 259.00000 | 259.66667 | 277.24592 | |
| 8 | 5 | 242.08741 | 248.00000 | 259.66667 | 277.24592 | |
| 9 | 5 | 242.08741 | 260.00000 | 259.66667 | 277.24592 | |
| 10 | 5 | 242.08741 | 255.00000 | 259.66667 | 277.24592 | |
| 11 | 5 | 242.08741 | 268.00000 | 259.66667 | 277.24592 | |
| 12 | 5 | 242.08741 | 253.00000 | 259.66667 | 277.24592 | |
| 13 | 5 | 242.08741 | 273.00000 | 259.66667 | 277.24592 | |
| 14 | 5 | 242.08741 | 275.00000 | 259.66667 | 277.24592 | 5 |
| 15 | 5 | 242.08741 | 257.00000 | 259.66667 | 277.24592 | |
| 16 | 5 | 242.08741 | 269.00000 | 259.66667 | 277.24592 | |
| 17 | 5 | 242.08741 | 249.00000 | 259.66667 | 277.24592 | |
| 18 | 5 | 242.08741 | 264.00000 | 259.66667 | 277.24592 | |
| 19 | 5 | 242.08741 | 258.00000 | 259.66667 | 277.24592 | |
| 20 | 5 | 242.08741 | 248.00000 | 259.66667 | 277.24592 | |
| 21 | 5 | 242.08741 | 248.00000 | 259.66667 | 277.24592 | |
| Test Descriptions | |
|---|---|
| Test 5 | Two out of three points in a row in Zone A or beyond |