IRCHART Statement: SHEWHART Procedure
Example 17.11 Applying Tests for Special Causes
See SHWIREX1 in the SAS/QC Sample LibraryThis example illustrates how you can apply tests for special causes to make an individual measurements chart more sensitive
to special causes of variation. The following statements create a data set named Engines, which contains the weights for 25 jet engines:
data Engines;
   input ID Weight @@;
   label Weight='Engine Weight (lbs)'
         ID    ='Engine ID Number';
   datalines;
1711 1270   1712 1258   1713 1248   1714 1260
1715 1263   1716 1260   1717 1259   1718 1240
1719 1260   1720 1246   1721 1238   1722 1253
1723 1249   1724 1245   1725 1251   1726 1252
1727 1249   1728 1274   1729 1258   1730 1268
1731 1248   1732 1295   1733 1243   1734 1253
1735 1258
;
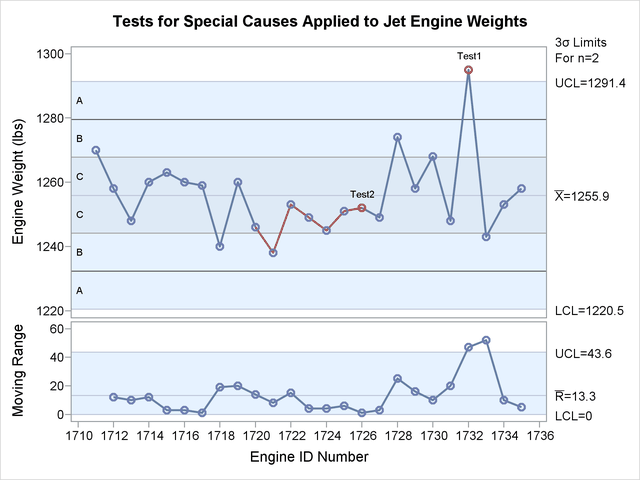
Individual measurements and moving range charts are used to monitor the weights. The following statements produce the tables shown in Output 17.11.1 and create the charts shown in Output 17.11.2:
title 'Tests for Special Causes Applied to Jet Engine Weights';
ods graphics on;
proc shewhart data=Engines;
   irchart Weight*ID /
       tests    = 1 to 8
       test2run = 7
       odstitle = title
       tabletest
       zonelabels
       markers;
run;
The TESTS= option applies eight tests for special causes, which are described in Tests for Special Causes: SHEWHART Procedure. The TEST2RUN= option specifies the length of the pattern for Test 2. The TABLETESTS option requests a table of individual measurements, moving ranges, and control limits, and it adds a column indicating which measurements tested positive for special causes.
The ZONELABELS option displays zone lines and zone labels on the individual measurements chart. The zones are used to define the tests.
Output 17.11.1: Tabular Form of Individual Measurements and Moving Range Chart
| Individual Measurements Chart Summary for Weight | |||||||
|---|---|---|---|---|---|---|---|
| ID | 3 Sigma Limits with n=2 for Weight | Special Tests Signaled |
3 Sigma Limits with n=2 for Moving Range |
||||
| Lower Limit |
Weight | Upper Limit |
Lower Limit |
Moving Range |
Upper Limit |
||
| 1711 | 1220.4709 | 1270.0000 | 1291.3691 | 0 | . | 43.553759 | |
| 1712 | 1220.4709 | 1258.0000 | 1291.3691 | 0 | 12.000000 | 43.553759 | |
| 1713 | 1220.4709 | 1248.0000 | 1291.3691 | 0 | 10.000000 | 43.553759 | |
| 1714 | 1220.4709 | 1260.0000 | 1291.3691 | 0 | 12.000000 | 43.553759 | |
| 1715 | 1220.4709 | 1263.0000 | 1291.3691 | 0 | 3.000000 | 43.553759 | |
| 1716 | 1220.4709 | 1260.0000 | 1291.3691 | 0 | 3.000000 | 43.553759 | |
| 1717 | 1220.4709 | 1259.0000 | 1291.3691 | 0 | 1.000000 | 43.553759 | |
| 1718 | 1220.4709 | 1240.0000 | 1291.3691 | 0 | 19.000000 | 43.553759 | |
| 1719 | 1220.4709 | 1260.0000 | 1291.3691 | 0 | 20.000000 | 43.553759 | |
| 1720 | 1220.4709 | 1246.0000 | 1291.3691 | 0 | 14.000000 | 43.553759 | |
| 1721 | 1220.4709 | 1238.0000 | 1291.3691 | 0 | 8.000000 | 43.553759 | |
| 1722 | 1220.4709 | 1253.0000 | 1291.3691 | 0 | 15.000000 | 43.553759 | |
| 1723 | 1220.4709 | 1249.0000 | 1291.3691 | 0 | 4.000000 | 43.553759 | |
| 1724 | 1220.4709 | 1245.0000 | 1291.3691 | 0 | 4.000000 | 43.553759 | |
| 1725 | 1220.4709 | 1251.0000 | 1291.3691 | 0 | 6.000000 | 43.553759 | |
| 1726 | 1220.4709 | 1252.0000 | 1291.3691 | 2 | 0 | 1.000000 | 43.553759 |
| 1727 | 1220.4709 | 1249.0000 | 1291.3691 | 0 | 3.000000 | 43.553759 | |
| 1728 | 1220.4709 | 1274.0000 | 1291.3691 | 0 | 25.000000 | 43.553759 | |
| 1729 | 1220.4709 | 1258.0000 | 1291.3691 | 0 | 16.000000 | 43.553759 | |
| 1730 | 1220.4709 | 1268.0000 | 1291.3691 | 0 | 10.000000 | 43.553759 | |
| 1731 | 1220.4709 | 1248.0000 | 1291.3691 | 0 | 20.000000 | 43.553759 | |
| 1732 | 1220.4709 | 1295.0000 | 1291.3691 | 1 | 0 | 47.000000 | 43.553759 |
| 1733 | 1220.4709 | 1243.0000 | 1291.3691 | 0 | 52.000000 | 43.553759 | |
| 1734 | 1220.4709 | 1253.0000 | 1291.3691 | 0 | 10.000000 | 43.553759 | |
| 1735 | 1220.4709 | 1258.0000 | 1291.3691 | 0 | 5.000000 | 43.553759 | |
Output 17.11.2: Tests for Special Causes

Output 17.11.1 and Output 17.11.2 indicate that Test 1 was positive for engine 1732 and Test 2 was positive for engine 1726. Test 1 detects one point beyond Zone A (outside the control limits) and Test 2 detects seven points (TEST2RUN=7) in a row on one side of the central line.
