Example 11.2 Creating Multivariate Control Charts for Phase II
This example is a continuation of the example in Getting Started: MVPMONITOR Procedure. The following statements create a data set named flightDelays2 which provides flight delays for the date range February 17–28, 2007, for the Northeastern U.S.:
data flightDelays2;
   label flightDate='Date';
   format flightDate MMDDYY8.;
   input flightDate :MMDDYY8. AA CO DL F9 FL NW UA US WN;
datalines;
02/17/07 25.6  7.8 15.5 13.4 16.1 16.2 23.0 24.2  8.2
02/18/07  5.4 16.0  9.9  1.1 11.5 17.0 15.6 15.5  5.1

   ... more lines ...

02/27/07 11.3 17.1  5.3  4.1  4.8 13.9  9.8  9.7  7.1
02/28/07  8.1  3.7  2.7 17.1 -0.8  5.5 11.0 14.3  3.1
;
In order to use PROC MVPMONITOR in a Phase II situation, you need a principal components model based on a process data from a stable process. The model produced by the MVPMODEL procedure in Combining Data from Peer Processes is used here. The model was generated from data for the continental U.S. during February 1–16, 2007. The model information is contained in the principal component loadings, which are saved in the OUTLOADINGS= data set named mvpairloadings. The following statements apply the model to the new data in flightDelays2:
proc mvpmonitor data=flightDelays2 loadings=mvpairloadings;
   time flightDate;
   id flightDate;
   scoreplot;
   tsquarechart;
   spechart;
run;
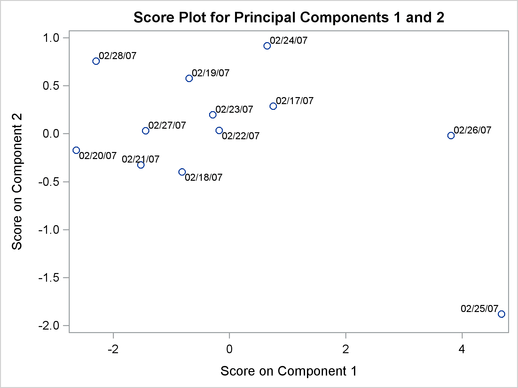
The score plot for the first and second principal component scores from the new data are shown in Output 11.2.1.
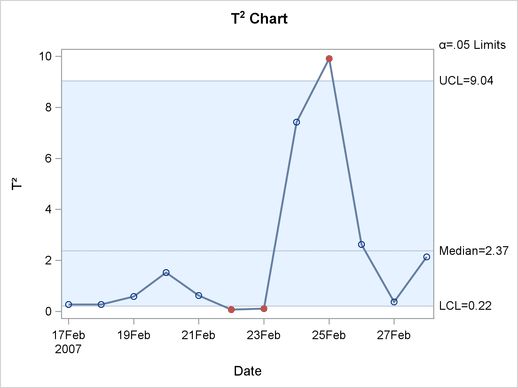
The  chart is in Output 11.2.2.
Statistics
The SPE chart is in Output 11.2.3.
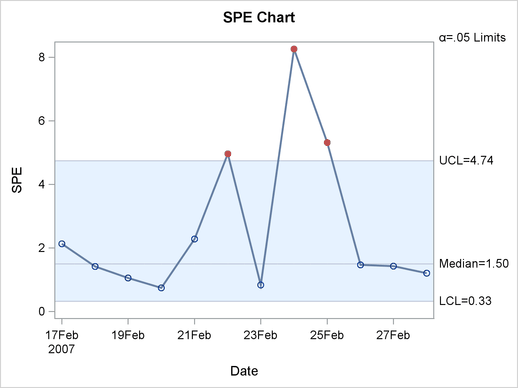
In the SPE chart, there are out-of-control points on February 22, 24, and 25. This indicates that the variation is not along the model hyperplane, which suggests that the model is not appropriate for this new data.
Both the SPE chart and the chart have an out-of-control point on February 25. This point has very unusual variation. On that date, there was a major winter storm with high winds and blizzard conditions hitting the Midwest in addition to snow, sleet, and freezing rain in the Northeast. These conditions contributed to delays that are not seen in the data set that the model was built with.
Note: This procedure is experimental.