| Classical T-Square Charts |
Classical  charts are defined as follows. Assume that there are
  observations for
  variables, denoted by
  , where
  is a -dimensional vector. The statistic for observation
  is
is
 |
where
 |
and
 |
For purposes of deriving control limits for the chart, it is assumed that has a -dimensional multivariate normal distribution with mean vector  and covariance matrix
  for
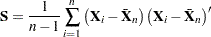
for  . The classical formulation of the chart does not involve a principal components model for the data and bases the computation of the on the sample covariance matrix
  . Refer to Alt (1985) for theoretical details and to the section Multivariate Control Charts for an example.
A classical chart is equivalent to a chart based on a full principal components model (with components) as discussed in the section Relationship of Principal Components to Multivariate Control Charts. See Example 10.2 for more discussion.
Note: This procedure is experimental.