| Relationship of Principal Components to Multivariate Control Charts |
Multivariate control charts typically plot the  statistic, which is a summary of multivariate variation. The classical statistic is defined in Classical T-Square Charts. When there is high correlation among the process variables, the correlation matrix is nearly singular. This is another way of saying that the subspace in which the process varies can be adequately explained by fewer variables than the original
  variables. Thus, the principal components approach to multivariate control charts is to project the original variables into a lower dimensional subspace using a model based on
  principal components where
  .
.
The key to the relationship between principal components and multivariate control charts is the decomposition of the sample covariance matrix,  , into the form
  , where
  is a diagonal matrix (Jackson; 1991; Mardia, Kent, and Bibby; 1979). This is another way of stating the eigenvalue decomposition of , where the columns of
  are the eigenvectors and the diagonal elements of are the eigenvalues.
Equivalence of Statistics
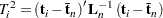
The statistic produced by the full principal components model is equivalent to the classical statistic. This is seen in the matrix representation of the statistic from the principal components using all variables
 |
Since  is the zero matrix by construction,
 |
Since  , then
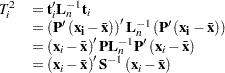 |
which is the classical form. Consequently the classical statistic can be expressed as a sum of squares,
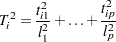 |
where  is the variance of the
  th principal component.
Charts Based on a Principal Components Model
Creating a chart based on a principal components model begins with choosing the number () of principal components. Effectively, this involves selecting a subspace in dimensions, and then creating a statistic based on that -component model.
The statistic is meant to monitor variation in the model space. However, if variation appears in the  subspace orthogonal to model space, then the model assumptions and physical process should be reexamined. Variation outside the model space can be detected with an SPE chart.
In a model with principal components, the statistic is calculated as
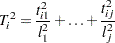 |
where  is the principal component score for the th principal component of the
  th observation and
  is the standard deviation for .
The information in the remaining principal components variables is monitored with charts for the SPE statistic,which is calculated as
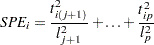 |
Note: This procedure is experimental.