XCHART Statement: CUSUM Procedure
- Overview
-
Getting Started

-
Syntax
-
Details
Basic Notation for Cusum Charts Formulas for Cumulative Sums Defining the Decision Interval for a One-Sided Cusum Scheme Defining the V-Mask for a Two-Sided Cusum Scheme Designing a Cusum Scheme Cusum Charts Compared with Shewhart Charts Methods for Estimating the Standard Deviation Output Data Sets ODS Tables ODS Graphics Input Data Sets Missing Values
-
Examples
Example 6.1 Cusum and Standard Deviation Charts
[See CUSXS in the SAS/QC Sample Library]When you are working with subgrouped data, it can be helpful to accompany a cusum chart for means with a Shewhart  chart for monitoring the variability of the process. This example creates this combination for the variable Weight in the data set Oil (see Creating a V-Mask Cusum Chart from Raw Data).
The first step is to create a one-sided cusum chart for means that detects a shift of one standard error ( ) below the target mean.
proc cusum data=Oil;
   xchart Weight*Hour /
      nochart
      mu0=8.100        /* target mean for process  */
      sigma0=0.050     /* known standard deviation */
      delta=-1         /* shift to be detected     */
      h=3              /* cusum parameter h        */
      k=0.5            /* cusum parameter k        */
      scheme=onesided
      outtable = Tabcusum
         ( drop   = _var_ _subn_ _subx_ _exlim_
           rename = ( _cusum_ = _subx_ _h_ = _uclx_ ) )
      ;
run;
The results are saved in an OUTTABLE= data set named Tabcusum. The cusum variable (_CUSUM_) and the decision interval variable (_H_) are renamed to _SUBX_ and _LCLX_ so that they can later be read by the SHEWHART procedure.
The next step is to construct a Shewhart  and chart for Weight and save the results in a data set named Tabxscht.
proc shewhart data=Oil;
   xschart Weight*Hour /
      nochart
      outtable = Tabxscht
         ( drop = _subx_  _uclx_ );
run;
Note that the variables _SUBX_ and _UCLX_ are dropped from Tabxscht.
The third step is to merge the data sets Tabcusum and Tabxscht.
data taball;
   merge Tabxscht Tabcusum; by Hour;
   _mean_ = _uclx_ * 0.5;
   _lclx_ = 0.0;
run;
The variable _LCLX_ is assigned the role of the lower limit for the cusums, and the variable _MEAN_ is assigned a dummy value. Now, TABALL, which is listed in Output 6.1.1, has the structure required for a TABLE= data set used with the XSCHART statement in the SHEWHART procedure (see TABLE= Data Set).
| Obs | _VAR_ | Hour | _SIGMAS_ | _LIMITN_ | _SUBN_ | _LCLX_ | _MEAN_ | _STDDEV_ | _EXLIM_ | _LCLS_ | _SUBS_ | _S_ | _UCLS_ | _EXLIMS_ | _subx_ | _uclx_ |
|---|---|---|---|---|---|---|---|---|---|---|---|---|---|---|---|---|
| 1 | Weight | 1 | 3 | 4 | 4 | 0 | 1.5 | 0.05 | 0 | 0.059640 | 0.049943 | 0.11317 | 0.00 | 3 | ||
| 2 | Weight | 2 | 3 | 4 | 4 | 0 | 1.5 | 0.05 | 0 | 0.090220 | 0.049943 | 0.11317 | 0.00 | 3 | ||
| 3 | Weight | 3 | 3 | 4 | 4 | 0 | 1.5 | 0.05 | 0 | 0.076346 | 0.049943 | 0.11317 | 0.00 | 3 | ||
| 4 | Weight | 4 | 3 | 4 | 4 | 0 | 1.5 | 0.05 | 0 | 0.025552 | 0.049943 | 0.11317 | 0.00 | 3 | ||
| 5 | Weight | 5 | 3 | 4 | 4 | 0 | 1.5 | 0.05 | 0 | 0.026500 | 0.049943 | 0.11317 | 0.00 | 3 | ||
| 6 | Weight | 6 | 3 | 4 | 4 | 0 | 1.5 | 0.05 | 0 | 0.075617 | 0.049943 | 0.11317 | 0.30 | 3 | ||
| 7 | Weight | 7 | 3 | 4 | 4 | 0 | 1.5 | 0.05 | 0 | 0.037242 | 0.049943 | 0.11317 | 0.00 | 3 | ||
| 8 | Weight | 8 | 3 | 4 | 4 | 0 | 1.5 | 0.05 | 0 | 0.059290 | 0.049943 | 0.11317 | 0.18 | 3 | ||
| 9 | Weight | 9 | 3 | 4 | 4 | 0 | 1.5 | 0.05 | 0 | 0.005737 | 0.049943 | 0.11317 | 1.21 | 3 | ||
| 10 | Weight | 10 | 3 | 4 | 4 | 0 | 1.5 | 0.05 | 0 | 0.046522 | 0.049943 | 0.11317 | 0.62 | 3 | ||
| 11 | Weight | 11 | 3 | 4 | 4 | 0 | 1.5 | 0.05 | 0 | 0.040542 | 0.049943 | 0.11317 | 0.00 | 3 | ||
| 12 | Weight | 12 | 3 | 4 | 4 | 0 | 1.5 | 0.05 | 0 | 0.056103 | 0.049943 | 0.11317 | 0.00 | 3 |
The final step is to use the SHEWHART procedure to read TABALL as a TABLE= data set and to display the cusum and charts.
ods graphics off;
symbol v=dot color=salmon h=1.8 pct;
title 'Cusum Chart for Mean and s chart';
proc shewhart table=taball;
   xschart Weight * Hour /
      nolimitslegend
      ucllabel = 'h=3.0'
      noctl
      split = '/'
      nolegend ;
   label _subx_ = 'Lower Cusum/Std Dev';
run;
The central line for the primary (cusum) chart is suppressed with the NOCTL option, and the default 3 Limits legend is suppressed with the NOLIMITLEGEND option. The charts are shown in Output 6.1.2.
Chart
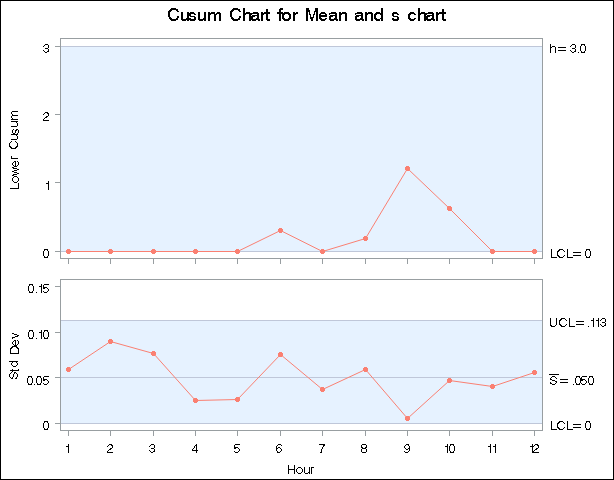
The process variability is stable, and there is no signal of a downward shift in the process mean.