QQPLOT Statement: CAPABILITY Procedure

Example 5.24 Estimating Cpk from a Normal Q-Q Plot
[See CAPQQ1 in the SAS/QC Sample Library]This example illustrates how you can use a normal Q-Q plot to estimate the capability index  . The data used here are the distance measurements provided in the section Creating a Normal Quantile-Quantile Plot.
The linearity of the point pattern in Figure 5.40 indicates that the measurements are normally distributed (recall that normality should be checked when process capability indices are reported). Furthermore, Figure 5.40 shows that the upper specification limit is about 1.7 standard deviation units above the mean, and the lower specification limit is about 1.8 standard deviation units below the mean. Since CPU is defined as
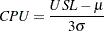 |
and CPL is defined as
 |
it follows that an estimate of CPU is  , and an estimate of CPL is
  . Thus, except for a factor of three, you can estimate CPU and CPL from the points of intersection between the specification lines and the point pattern.
The following statements facilitate this type of estimation by creating a Q-Q plot, displayed in Output 5.24.1, in which the horizontal axis is rescaled by a factor of three:
ods graphics off;
symbol v=plus;
title "Normal Quantile-Quantile Plot for Hole Distance";
proc capability data=Sheets noprint;
   spec  lsl=9.5   llsl=2   clsl=blue
         usl=10.5  lusl=20  cusl=blue;
   qqplot Distance / normal(mu=est sigma=est cpkscale cpkref)
                 nolegend
                 square;
   inset n mean (5.2) std="Std Dev" (4.2) cpk (4.2) /
         pos=(-0.75,10.48) data refpoint=tl;
run;
The CPKSCALE option rescales the horizontal axis, and the CPKREF option adds reference lines indicating the intersections of the distribution reference line and the specification limits.
Scaling
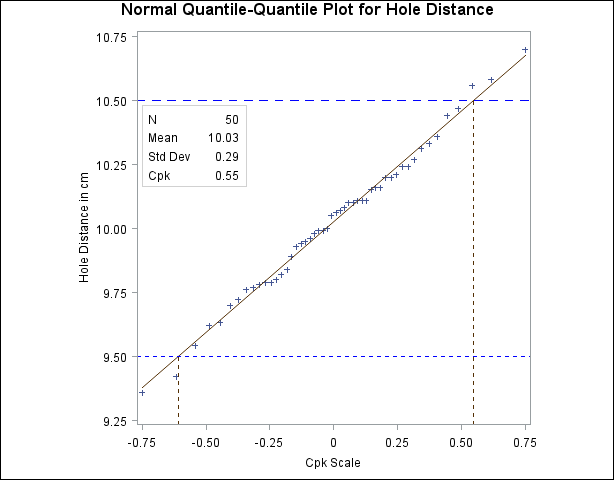
Using this display, you can estimate CPU and CPL directly from the horizontal axis as 0.55 and 0.60, respectively (the negative sign for  is ignored). The minimum of these values (0.55) is an estimate of . Note that this estimate agrees with the numerically obtained estimate for that is displayed on the plot with the INSET statement.
See Rodriguez (1992) for further discussion concerning the use of Q-Q plots in process capability analysis.