QQPLOT Statement: CAPABILITY Procedure

Adding a Distribution Reference Line
[See CAPQQ1 in the SAS/QC Sample Library]In a normal Q-Q plot, the normal distribution with mean  and standard deviation
  is represented by a reference line with intercept and slope . The following statements reproduce the Q-Q plot in Figure 5.39, adding the line for which and are estimated by the sample mean and standard deviation:
symbol v=plus;
title 'Normal Quantile-Quantile Plot for Hole Distance';
proc capability data=Sheets noprint;
   spec lsl=9.5 usl=10.5;
   qqplot Distance / normal(mu=est sigma=est color=black l=2)
                     square
                     nospeclegend;
run;
The plot is displayed in Figure 5.40.
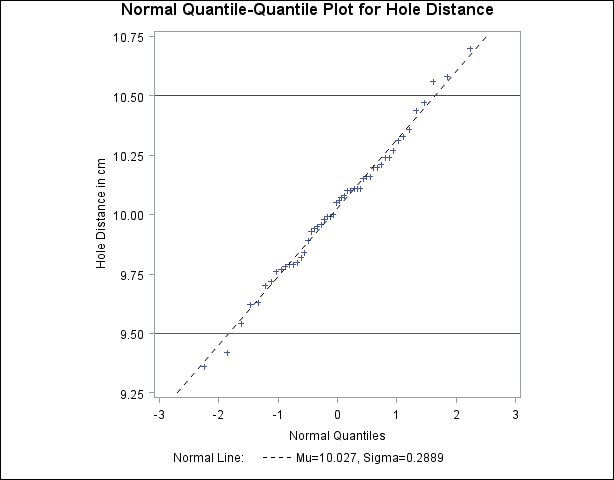
Specifying MU=EST and SIGMA=EST with the NORMAL option requests the reference line (alternatively, you can specify numeric values for and with the MU= and SIGMA= options). The COLOR= and L= options specify the color of the line and the line type. The SQUARE option displays the plot in a square format, and the NOSPECLEGEND option suppresses the legend for the specification lines.