INSET Statement: CAPABILITY Procedure

Displaying Summary Statistics on a Histogram
[See CAPINS1 in the SAS/QC Sample Library]In a plant producing copper wire, an important quality characteristic is the torsion strength, measured as the twisting force in pounds per inch necessary to break the wire. The following statements create the SAS data set Wire, which contains the torsion strengths (Strength) for 50 different wire samples:
data Wire;
   label Strength='Torsion Strength in lb/in';
   input Strength @@;
   datalines;
25 25 36 31 26 36 29 37 37 20
34 27 21 35 30 41 33 21 26 26
19 25 14 32 30 29 31 26 22 24
34 33 28 26 43 30 40 32 32 31
25 26 27 34 33 27 33 29 30 31
;
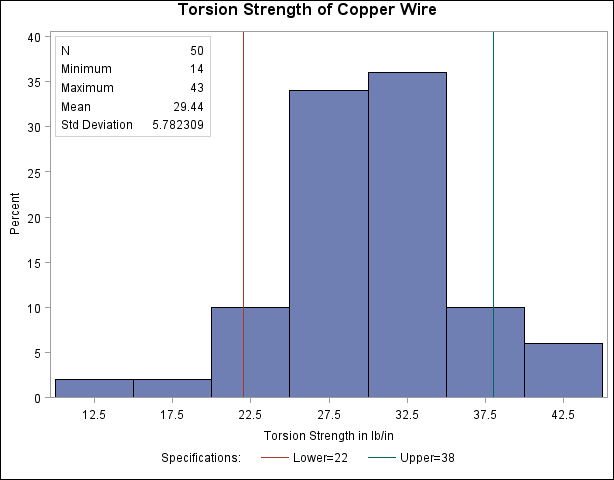
A histogram is used to examine the data distribution. For a more complete report, the sample size, minimum value, maximum value, mean, and standard deviation are displayed on the histogram. The following statements illustrate how to inset these statistics:
ods graphics off;
title 'Torsion Strength of Copper Wire';
proc capability data=Wire noprint;
   spec lsl=22 usl=38;
   histogram Strength;
   inset n min max mean std;
run;
The resulting histogram is displayed in Figure 5.17. The INSET statement immediately follows the plot statement that creates the graphical display (in this case, the HISTOGRAM statement). Specify the keywords for inset statistics (such as N, MIN, MAX, MEAN, and STD) immediately after the word INSET. The inset statistics appear in the order in which you specify the keywords.
A complete list of keywords that you can use with the INSET statement is provided in Summary of INSET Keywords. Note that the set of keywords available for a particular display depends on both the plot statement that precedes the INSET statement and the options that you specify in the plot statement.
The following examples illustrate options commonly used for enhancing the appearance of an inset.