| The SHEWHART Procedure |
Example 13.39 Specifying Standard Values for the Process Mean and Standard Deviation
[See SHWXR3 in the SAS/QC Sample Library]By default, the XRCHART statement estimates the process mean ( ) and standard deviation (
 ) from the data, as in the previous example. However, there are applications in which standard values (
 and
and  ) are available based, for instance, on previous experience or extensive sampling. You can specify these values with the MU0= and SIGMA0= options.
For example, suppose it is known that the adhesive coating process introduced in the previous example has a mean of 1260 and standard deviation of 15. The following statements specify these standard values:
title 'Specifying Standard Process Mean and Standard Deviation';
proc shewhart history=Tape;
   xrchart Weight*Sample / mu0     = 1260
                           sigma0  = 15
                           xsymbol = mu0;
run;
The XSYMBOL= option specifies the label for the central line on the  chart. The resulting and
  charts are shown in Output 13.39.1.
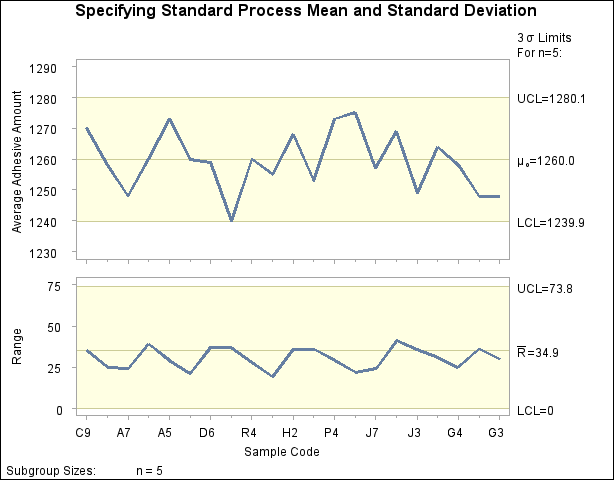
The central lines and control limits for both charts are determined by using and (see the equations in Table 13.71). Output 13.39.1 indicates that the process is in statistical control.
You can also specify and with the variables _MEAN_ and _STDDEV_ in a LIMITS= data set, as illustrated by the following statements:
data Tapelim;
   length _var_ _subgrp_ _type_ $8;
   _var_    = 'Weight';
   _subgrp_ = 'Sample';
   _type_   = 'STANDARD';
   _limitn_ = 5;
   _mean_   = 1260;
   _stddev_ = 15;

proc shewhart history=Tape limits=Tapelim;
   xrchart Weight*Sample / xsymbol=mu0;
run;
The variables _VAR_ and _SUBGRP_ are required, and their values must match the process and subgroup-variable, respectively, specified in the XRCHART statement. The bookkeeping variable _TYPE_ is not required, but it is recommended to indicate that the variables _MEAN_ and _STDDEV_ provide standard values rather than estimated values.
The resulting charts (not shown here) are identical to those shown in Output 13.39.1.
Copyright © SAS Institute, Inc. All Rights Reserved.